This site uses cookies to improve your experience. To help us insure we adhere to various privacy regulations, please select your country/region of residence. If you do not select a country, we will assume you are from the United States. Select your Cookie Settings or view our Privacy Policy and Terms of Use.
Cookie Settings
Cookies and similar technologies are used on this website for proper function of the website, for tracking performance analytics and for marketing purposes. We and some of our third-party providers may use cookie data for various purposes. Please review the cookie settings below and choose your preference.
Used for the proper function of the website
Used for monitoring website traffic and interactions
Cookie Settings
Cookies and similar technologies are used on this website for proper function of the website, for tracking performance analytics and for marketing purposes. We and some of our third-party providers may use cookie data for various purposes. Please review the cookie settings below and choose your preference.
Strictly Necessary: Used for the proper function of the website
Performance/Analytics: Used for monitoring website traffic and interactions
This article was published as a part of the Data Science Blogathon Image 1In this blog, We are going to talk about some of the advanced and most used charts in Plotly while doing analysis. All you need to know is Plotly for visualization!
Big data is conventionally understood in terms of its scale. This one-dimensional approach, however, runs the risk of simplifying the complexity of big data. In this blog, we discuss the 10 Vs as metrics to gauge the complexity of big data.
In this blog post, we are going to share the top 10 YouTube videos for learning about LLMs. In this video, you will learn how to use ChatGPT to perform common data analysis tasks, such as datacleaning, data exploration, and datavisualization.
In this blog, we will discuss exploratory data analysis, also known as EDA, and why it is important. This can be useful for identifying patterns and trends in the data. Plotly : This library is a datavisualization tool that creates interactive, web-based plots. So, without any further ado let’s dive right in.
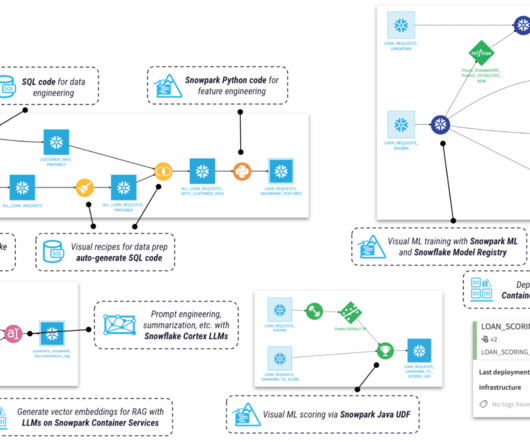
Snowflake excels in efficient data storage and governance, while Dataiku provides the tooling to operationalize advanced analytics and machine learning models. Together they create a powerful, flexible, and scalable foundation for modern data applications.
In-depth data analysis using GPT-4’s datavisualization toolset. dallE-2: painting in impressionist style with thick oil colors of a map of Europe Efficiency is everything for coders and data analysts. Join thousands of data leaders on the AI newsletter. Let’s get to it.
Today’s question is, “What does a data scientist do.” ” Step into the realm of data science, where numbers dance like fireflies and patterns emerge from the chaos of information. In this blog post, we’re embarking on a thrilling expedition to demystify the enigmatic role of data scientists.
In addition, online Data Science bootcamps and the Job Guarantee Program have also emerged as good learning options for individuals who want to make a career as a Data Scientist. To simplify the task, we have curated this blog. What is Data Science?
Cheat sheets for Data Scientists are concise, organized reference guides that provide Data Scientists with the fundamental knowledge and key techniques they need to excel in their work. Here, we’ll explore why Data Science is indispensable in today’s world.
Data wrangling prepares raw data for analysis by cleaning, converting, and manipulating it. It might be a time-consuming operation but it is a necessary stage in data analysis. This blog article will look at manipulating data using Python and Jupyter Notebooks.
Key Features of Power BI: Power BI is a powerful business intelligence tool developed by Microsoft that enables users to visualize and analyze data from various sources. It offers a wide range of features that make it a popular choice for data professionals, analysts, and organizations. appeared first on Pickl AI.
According to a report from Statista, the global big data market is expected to grow to over $103 billion by 2027, highlighting the increasing importance of data handling practices. Key Takeaways Data preprocessing is crucial for effective Machine Learning model training. Matplotlib/Seaborn: For datavisualization.
Accordingly, Data Analysts use various tools for Data Analysis and Excel is one of the most common. Significantly, the use of Excel in Data Analysis is beneficial in keeping records of data over time and enabling datavisualization effectively. How to use Excel in Data Analysis and why is it important?
Widely used in Machine Learning and Artificial Intelligence, expanding its applications beyond Data Analysis. Read Blog: Machine Learning Engineer Salary in India R R is a programming language specifically designed for statistics and Data Analysis. Strong community support, with numerous resources and tutorials available.
Furthermore, with the ability to manipulate data efficiently, companies can unlock their true potential, which can eventually help in boosting their productivity and gain a competitive edge. Key Features of Data Manipulation Data Filtering Filtering of data is an integral aspect of data manipulation.
Photo by Juraj Gabriel on Unsplash Data analysis is a powerful tool that helps businesses make informed decisions. In today’s blog, we will explore the Netflix dataset using Python and uncover some interesting insights. Let’s explore the dataset further by cleaningdata and creating some visualizations.
In the digital age, the abundance of textual information available on the internet, particularly on platforms like Twitter, blogs, and e-commerce websites, has led to an exponential growth in unstructured data. It involves removing duplicate records, correcting spelling errors, and handling noisy data.
Accordingly, the need to evaluate meaningful data for businesses has invoked myriad job opportunities in Data Science. If you are a Data Science aspirant and want to know how to become a Data Scientist in 2023, this is your guide. What does a Data Scientist do?
Do you want to be a data analyst? Data analysts are in high demand: From technology giants like IBM and Microsoft to our favorite media streaming providers like Netflix and Amazon Prime, organizations are increasingly relying on data analytics to make smart business decisions. […]. If so, great career choice!
Hey guys, in this blog we will see some of the most asked Data Science Interview Questions by interviewers in [year]. Data science has become an integral part of many industries, and as a result, the demand for skilled data scientists is soaring. What is Data Science? Why is datacleaning crucial?
We organize all of the trending information in your field so you don't have to. Join 17,000+ users and stay up to date on the latest articles your peers are reading.
You know about us, now we want to get to know you!
Let's personalize your content
Let's get even more personalized
We recognize your account from another site in our network, please click 'Send Email' below to continue with verifying your account and setting a password.


Let's personalize your content