This site uses cookies to improve your experience. To help us insure we adhere to various privacy regulations, please select your country/region of residence. If you do not select a country, we will assume you are from the United States. Select your Cookie Settings or view our Privacy Policy and Terms of Use.
Cookie Settings
Cookies and similar technologies are used on this website for proper function of the website, for tracking performance analytics and for marketing purposes. We and some of our third-party providers may use cookie data for various purposes. Please review the cookie settings below and choose your preference.
Used for the proper function of the website
Used for monitoring website traffic and interactions
Cookie Settings
Cookies and similar technologies are used on this website for proper function of the website, for tracking performance analytics and for marketing purposes. We and some of our third-party providers may use cookie data for various purposes. Please review the cookie settings below and choose your preference.
Strictly Necessary: Used for the proper function of the website
Performance/Analytics: Used for monitoring website traffic and interactions
Learn about 33 tools to visualize data with this blog In this blog post, we will delve into some of the most important plots and concepts that are indispensable for any data scientist. This plot is particularly useful for tasks like hypothesistesting, anomaly detection, and model evaluation.
I have explained normal distribution in very simple words and with examples in the below blog. This means that as the sample size increases, the distribution of the sum or average becomes more tightly clustered around the mean of the distribution, and the shape of the distribution becomes more bell-shaped.
This blog aims to clarify what parameters are, explain their role in accurately representing populations, and discuss their importance in drawing meaningful conclusions. Parameters thus serve as the foundation for hypothesistesting, predictive modelling, and decision-making.
This blog aims to explain variance, explain its calculation, and highlight real-world applications. In simple terms, variance captures the degree of “spread-outness” in a dataset—whether the values are clustered closely around the mean or widely dispersed. What Does Variance Measure?
In this blog, we will explore the arena of data science bootcamps and lay down a guide for you to choose the best data science bootcamp. Machine Learning : Supervised and unsupervised learning algorithms, including regression, classification, clustering, and deep learning. What do Data Science Bootcamps Offer?
Focusing on the various statistical models in R with examples, the following blog will help you learn in detail about these techniques and enhance your knowledge. This could be linear regression, logistic regression, clustering , time series analysis , etc. What is Statistical Modeling?
This blog aims to explain what Statistical Modeling is, highlight its key components, and explore its applications across various sectors. Statistical Modeling uses mathematical frameworks to represent real-world data and make predictions, analyse relationships, or test hypotheses. What is Statistical Modeling?
Hence, you can use R for classification, clustering, statistical tests and linear and non-linear modelling. It provides functions for descriptive statistics, hypothesistesting, regression analysis, time series analysis, survival analysis, and more. How is R Used in Data Science?
This blog will delve into the reasons why Python is essential for Data Analysis, highlighting its key features, libraries, and applications. Statsmodels Allows users to explore data, estimate statistical models, and perform statistical tests. It is particularly useful for regression analysis and hypothesistesting.
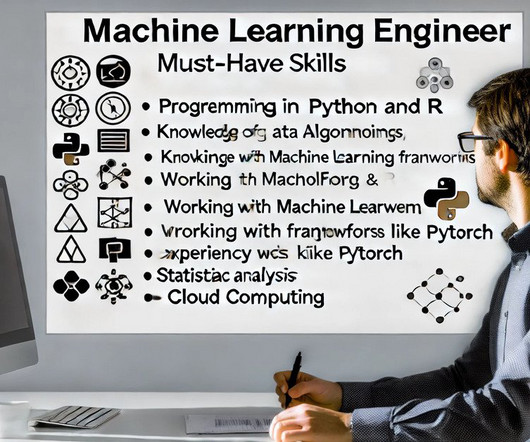
Summary: The blog discusses essential skills for Machine Learning Engineer, emphasising the importance of programming, mathematics, and algorithm knowledge. This blog outlines essential Machine Learning Engineer skills to help you thrive in this fast-evolving field. The global Machine Learning market was valued at USD 35.80
This blog aims to provide a comprehensive overview of a typical Big Data syllabus, covering essential topics that aspiring data professionals should master. Some of the most notable technologies include: Hadoop An open-source framework that allows for distributed storage and processing of large datasets across clusters of computers.
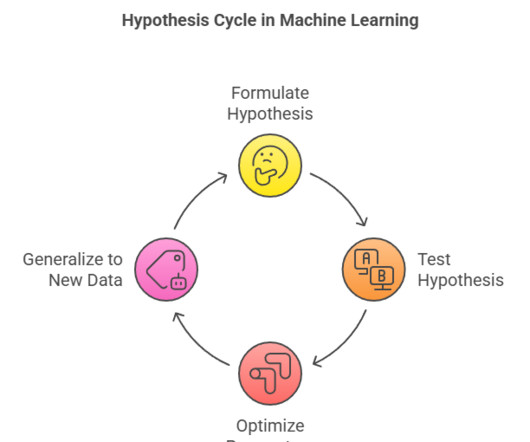
At the heart of this process lies the concept of hypothesis, which acts as the foundation for building predictive models. This blog explores the role of hypothesis in Machine Learning , their formulation, representation, testing, and optimization.
Some of the top Data Science courses for Kids with Python have been mentioned in this blog for you. After that, move towards unsupervised learning methods like clustering and dimensionality reduction. It includes regression, classification, clustering, decision trees, and more. Read below to find out!
In this blog, we will explore what makes Data Science seem hard, break down its components, discuss common challenges, compare it to other fields, provide tips for overcoming obstacles, and highlight the rewards of mastering Data Science. However, many aspiring professionals wonder: Is Data Science hard?
This blog provides a comprehensive roadmap for aspiring Data Scientists, highlighting the essential skills required to succeed in this constantly changing field. By the end of this blog, you will feel empowered to explore the exciting world of Data Science and achieve your career goals.
This blog is a small guide that will help you build your entry-level Data Analyst portfolio effectively. Technical Blog Posts (Optional): If you enjoy writing, consider adding blog posts that detail your data analysis process, insights, and any challenges you encountered. How to build a Data Analyst Portfolio?
These models may include regression, classification, clustering, and more. Statistical Analysis: Hypothesistesting, probability, regression analysis, etc. Read Blog Data Engineering Interview Questions and Answers Role of Data Engineers Data Engineers are the architects of data infrastructure.
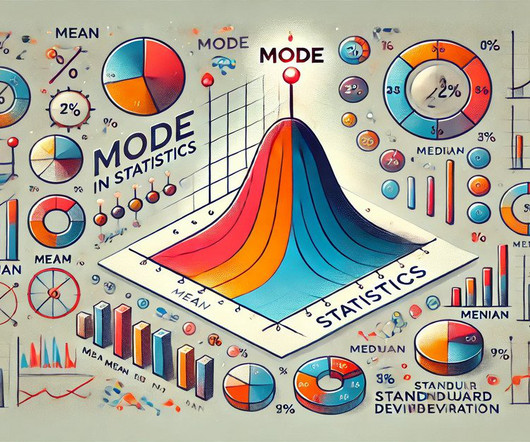
In Inferential Statistics, you can learn P-Value , T-Value , HypothesisTesting , and A/B Testing , which will help you to understand your data in the form of mathematics. In Descriptive Statistics, you need to focus on topics like Mean , Median , Mode, and Standard Deviation.
Here are some important blogs for you related to statistics: Process and Types of HypothesisTesting in Statistics. Bimodal distributions are useful when the data has two peaks or clusters, reflecting two dominant groups within a single dataset. A Comprehensive Guide to Descriptive Statistics.
This comprehensive blog outlines vital aspects of Data Analyst interviews, offering insights into technical, behavioural, and industry-specific questions. Then, I would use clustering techniques such as k-means or hierarchical clustering to group customers based on similarities in their purchasing behaviour.
Summary: The blog explores the synergy between Artificial Intelligence (AI) and Data Science, highlighting their complementary roles in Data Analysis and intelligent decision-making. Hypothesistesting and regression analysis are crucial for making predictions and understanding data relationships.
Hey guys, in this blog we will see some of the most asked Data Science Interview Questions by interviewers in [year]. Read the full blog here — [link] Data Science Interview Questions for Freshers 1. What is the p-value and what does it indicate in the Null Hypothesis? So this is all for this blog folks.
We organize all of the trending information in your field so you don't have to. Join 17,000+ users and stay up to date on the latest articles your peers are reading.
You know about us, now we want to get to know you!
Let's personalize your content
Let's get even more personalized
We recognize your account from another site in our network, please click 'Send Email' below to continue with verifying your account and setting a password.


Let's personalize your content