This site uses cookies to improve your experience. To help us insure we adhere to various privacy regulations, please select your country/region of residence. If you do not select a country, we will assume you are from the United States. Select your Cookie Settings or view our Privacy Policy and Terms of Use.
Cookie Settings
Cookies and similar technologies are used on this website for proper function of the website, for tracking performance analytics and for marketing purposes. We and some of our third-party providers may use cookie data for various purposes. Please review the cookie settings below and choose your preference.
Used for the proper function of the website
Used for monitoring website traffic and interactions
Cookie Settings
Cookies and similar technologies are used on this website for proper function of the website, for tracking performance analytics and for marketing purposes. We and some of our third-party providers may use cookie data for various purposes. Please review the cookie settings below and choose your preference.
Strictly Necessary: Used for the proper function of the website
Performance/Analytics: Used for monitoring website traffic and interactions
Summary of approach: In the end I managed to create two submissions, both employing an ensemble of models trained across all 10-fold cross-validation (CV) splits, achieving a private leaderboard (LB) score of 0.7318.
This is a unique opportunity for data people to dive into real-world data and uncover insights that could shape the future of aviation safety, understanding, airline efficiency, and pilots driving planes. When implementing these models, you’ll typically start by preprocessing your time series data (e.g.,
Data storage : Store the data in a Snowflake data warehouse by creating a data pipe between AWS and Snowflake. Data Extraction, Preprocessing & EDA : Extract & Pre-process the data using Python and perform basic ExploratoryDataAnalysis. The data is in good shape.
Its ability to make decisions based on the proximity of data points makes it particularly valuable in real-world applications. This blog aims to familiarise you with the fundamentals of the KNN algorithm in machine learning and its importance in shaping modern data analytics methodologies.
Applying XGBoost on a Problem Statement Applying XGBoost to Our Dataset Summary Citation Information Scaling Kaggle Competitions Using XGBoost: Part 4 Over the last few blog posts of this series, we have been steadily building up toward our grand finish: deciphering the mystery behind eXtreme Gradient Boosting (XGBoost) itself.
This comprehensive blog outlines vital aspects of Data Analyst interviews, offering insights into technical, behavioural, and industry-specific questions. It covers essential topics such as SQL queries, data visualization, statistical analysis, machine learning concepts, and data manipulation techniques.
Certainly, Data Scientists make use of different statistical modeling techniques that help in finding relationships between data. Focusing on the various statistical models in R with examples, the following blog will help you learn in detail about these techniques and enhance your knowledge. What is Statistical Modeling?
This blog will explore the intricacies of AI Time Series Forecasting, its challenges, popular models, implementation steps, applications, tools, and future trends. Making Data Stationary: Many forecasting models assume stationarity. In 2024, the global Time Series Forecasting market was valued at approximately USD 214.6
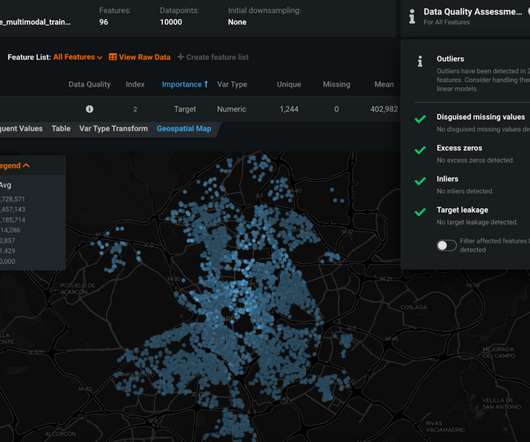
You can understand the data and model’s behavior at any time. Once you use a training dataset, and after the ExploratoryDataAnalysis, DataRobot flags any data quality issues and, if significant issues are spotlighted, will automatically handle them in the modeling stage. Rapid Modeling with DataRobot AutoML.
It is therefore important to carefully plan and execute data preparation tasks to ensure the best possible performance of the machine learning model. It is also essential to evaluate the quality of the dataset by conducting exploratorydataanalysis (EDA), which involves analyzing the dataset’s distribution, frequency, and diversity of text.
We organize all of the trending information in your field so you don't have to. Join 17,000+ users and stay up to date on the latest articles your peers are reading.
You know about us, now we want to get to know you!
Let's personalize your content
Let's get even more personalized
We recognize your account from another site in our network, please click 'Send Email' below to continue with verifying your account and setting a password.


Let's personalize your content