This site uses cookies to improve your experience. To help us insure we adhere to various privacy regulations, please select your country/region of residence. If you do not select a country, we will assume you are from the United States. Select your Cookie Settings or view our Privacy Policy and Terms of Use.
Cookie Settings
Cookies and similar technologies are used on this website for proper function of the website, for tracking performance analytics and for marketing purposes. We and some of our third-party providers may use cookie data for various purposes. Please review the cookie settings below and choose your preference.
Used for the proper function of the website
Used for monitoring website traffic and interactions
Cookie Settings
Cookies and similar technologies are used on this website for proper function of the website, for tracking performance analytics and for marketing purposes. We and some of our third-party providers may use cookie data for various purposes. Please review the cookie settings below and choose your preference.
Strictly Necessary: Used for the proper function of the website
Performance/Analytics: Used for monitoring website traffic and interactions
Unlock the full potential of your data with the power of datavisualization! Go through this blog and discover why visualizations are crucial in Data Science and explore the most effective and game-changing types of visualizations that will revolutionize the way you interpret and extract insights from your data.
In this blog, we will discuss exploratory dataanalysis, also known as EDA, and why it is important. We will also be sharing code snippets so you can try out different analysis techniques yourself. This can be useful for identifying patterns and trends in the data. So, without any further ado let’s dive right in.
Dataanalysis is an essential process in today’s world of business and science. It involves extracting insights from large sets of data to make informed decisions. One of the most common ways to represent a dataanalysis is through code. However, is code the best way to represent a dataanalysis?
It’s a versatile tool used in various applications, from scientific computing to dataanalysis and datavisualization. In this blog, we’ll explore the ins and outs of numpy.linspace() and how you […] The post What is numpy.linspace() in Python? appeared first on Analytics Vidhya.
To address this challenge, businesses need to use advanced dataanalysis methods. These methods can help businesses to make sense of their data and to identify trends and patterns that would otherwise be invisible. In recent years, there has been a growing interest in the use of artificial intelligence (AI) for dataanalysis.
Source: Stephen Wolfram Writings Read this blog to Master ChatGPT cheatsheet 2. Here are some examples of how you can use the Noteable Notebook plugin for ChatGPT: Exploratory DataAnalysis (EDA): You can use the plugin to generate descriptive statistics, create visualizations, and identify patterns in your data.
Introduction Welcome to our comprehensive dataanalysisblog that delves deep into the world of Netflix. Netflix’s Global Reach Netflix […] The post Netflix Case Study (EDA): Unveiling Data-Driven Strategies for Streaming appeared first on Analytics Vidhya.
In this blog, we will explore the top 7 blogs of 2023 that have been instrumental in disseminating detailed and updated information in these dynamic fields. These blogs stand out not just for their depth of content but also for their ability to make complex topics accessible to a broader audience.
There is no disputing the fact that the collection and analysis of massive amounts of unstructured data has been a huge breakthrough. This is something that you can learn more about in just about any technology blog. We would like to talk about datavisualization and its role in the big data movement.
In this blog post, we are going to share the top 10 YouTube videos for learning about LLMs. Master ChatGPT for DataAnalysis and Visualization! ChatGPT is a large language model that can be used for a variety of tasks, including dataanalysis and visualization.
Data is an essential component of any business, and it is the role of a data analyst to make sense of it all. Power BI is a powerful datavisualization tool that helps them turn raw data into meaningful insights and actionable decisions. Check out this course and learn Power BI today!
Adding to your data science productivity toolbox Dall-E image: impressionist painting in oil colors of a datavisualization bar chart GPT-4’s Advanced DataAnalysis tool (ADA) is an essential tool to add to your data science toolbox, allowing complex datasets to be understood quickly and efficiently.
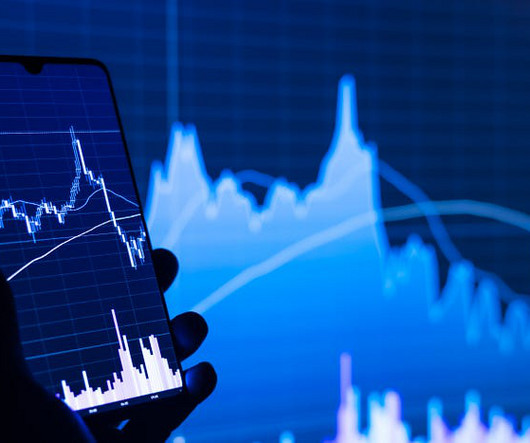
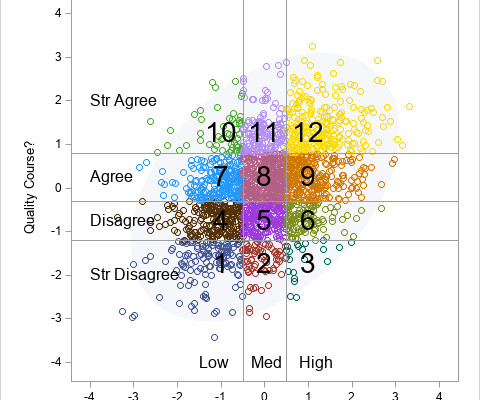
Can it do decent quantitative analysis from a datavisualization? For me, one of the most useful GPT-4 tools is the ability to analyze and interpret image data. But how good it this tool now with charting data and with map images? Join thousands of data leaders on the AI newsletter.
In this blog post, we will explore some of the essential research tools that every researcher should have in their toolkit. From data collection to dataanalysis and presentation, this blog will cover it all. SPSS – SPSS is a statistical software package used for dataanalysis, data mining, and forecasting.
A case study example with UN population projection data The GPT-4 Python Code Interpreter, is turning heads in the world of data science for its ability to instantly generate datavisualization code AND display the results. How does it… Read the full blog for free on Medium.
My methods of using GPT-4 to optimize my datavisual workflow For the past 6 months, I have been a heavy daily GPT-4 user. I know it makes me sound like an addict, but I have found many good reasons and many excellent use cases where this tool is an invaluable resource for improving my data workflow.
Can it do decent quantitative analysis from a datavisualization? For me, one of the most useful GPT-4 tools is the ability to analyze and interpret image data. But how good it this tool now with charting data and with map images? Join thousands of data leaders on the AI newsletter.
Big data is conventionally understood in terms of its scale. This one-dimensional approach, however, runs the risk of simplifying the complexity of big data. In this blog, we discuss the 10 Vs as metrics to gauge the complexity of big data. Both Data Mining and Big DataAnalysis are major elements of data science.
Introduction Data Science is everywhere in the 21st century and has emerged as an innovative field. But what exactly is Data Science? This blog post aims to answer these questions and more. And why should one consider specializing in it?
While it has always been a data-intensive process, enterprise fraud management today is more complex and more important than ever. This blog post explores the evolving role of enterprise fraud management, examines the impact of AI and showcases the importance of visualdataanalysis. Let’s take a closer look.
No-code prompts for rapid datavisualization reporting This member-only story is on us. As a computer science professor of 20+ years, I have heaps of experience in writing Python code for datavisualizations. This has changed with the new dataanalysis tools that are built in to the GPT-4 chat interface.
With its advanced natural language processing capabilities, ChatGPT can uncover hidden patterns and trends in your data that you never thought possible. In this blog post, we’ll explore how ChatGPT can revolutionize your data with […] The post Analyzing Data Made Effortless Using ChatGPT appeared first on Analytics Vidhya.
As we have to be methodical about it, we’ll quickly see that we… Read the full blog for free on Medium. Join thousands of data leaders on the AI newsletter. Join over 80,000 subscribers and keep up to date with the latest developments in AI. From research to projects and ideas.
This blog lists down-trending data science, analytics, and engineering GitHub repositories that can help you with learning data science to build your own portfolio. What is GitHub? GitHub is a powerful platform for data scientists, data analysts, data engineers, Python and R developers, and more.
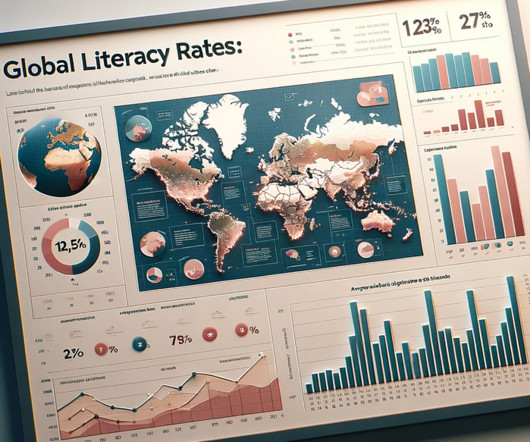
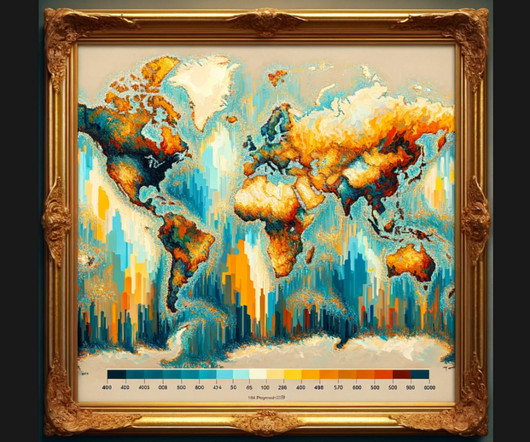
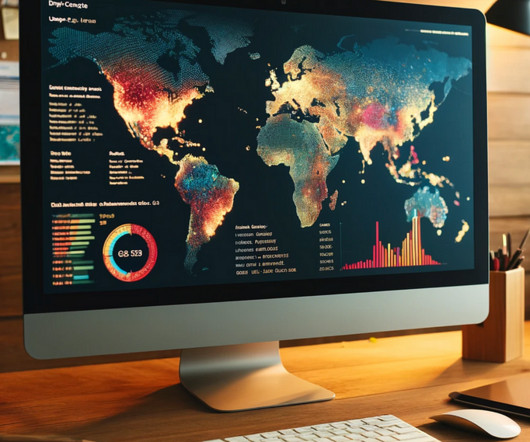
Visualize and generate datavisual reports with no muss or fussDall-E 2 generated Image: Visual dashboard showing global literacy rates An awesome new capability of GPT-4 is the ability to create PDF files on the fly — even from data that you’ve just created— including charts AND maps.
Introduction Analytics Vidhya DataHour is designed to provide valuable insights and knowledge to individuals looking to build a career in the data-tech industry. These sessions cover a wide range of topics, from the fields of artificial intelligence, and machine learning, and various topics related to data science.
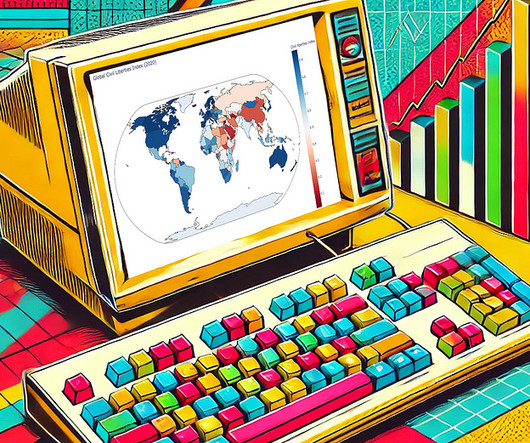
A zero-code map-and-charts dashboard for global literacy dataDall-E 2 generated choropleth map image Recently, GPT-4 has gone through a positive overhaul of its datavisualization capabilities. The new power of this update is the simplicity of creating datavisualizations from complex datasets on-the-fly using basic prompt engineering.
Removing the “advanced” for simple and useful dataanalysis This member-only story is on us. Dall-e created image — impressionist painting in vivid thick oil colors of a map of Earth With data science, turning raw numbers into meaningful datavisuals can be a monumental task, particularly for novice programmers.
In 2024, I wrote about 80 articles for The DO Loop blog. My most popular articles were about SAS programming, datavisualization, and statistics. The post Top 10 posts from <em>The DO Loop</em> in 2024 appeared first on SAS Blogs. SAS Programming The following [.]
Summary: Datavisualization is essential for interpreting complex information. This article covers various types of datavisualization, such as bar charts, line graphs, and heat maps. This blog will explore various types of datavisualization, their unique features, and when to use them.
GPT-4 no-code prompting for rapid datavisualization reporting As a computer science professor of 20+ years, I have oodles of experience in coding Python for datavisualizations. Until recently, the generation of beautiful datavisualizations has been the domain of folks like me — computer programmers and data analysts.
Summary: Datavisualization is the art of transforming complex data sets into easily understandable visuals like charts, graphs, and maps. By presenting information visually, datavisualization allows us to communicate insights clearly and effectively to a wider audience.
We can see by the observation that if we… Read the full blog for free on Medium. Join thousands of data leaders on the AI newsletter. Now if we want to do a choropleth map to show each country over time (by heat map), then we really only want the rows that actually have a value for the 3-letter ISO field.
7 types of statistical distributions with practical examples Statistical distributions help us understand a problem better by assigning a range of possible values to the variables, making them very useful in data science and machine learning. Here are 7 types of distributions with intuitive examples that often occur in real-life data.
In-depth dataanalysis using GPT-4’s datavisualization toolset. dallE-2: painting in impressionist style with thick oil colors of a map of Europe Efficiency is everything for coders and data analysts. With GPT-4’s Advanced DataAnalysis (ADA) toolset, this process becomes significantly more streamlined.
Super quick charts and maps from the Global Peace Index CSV With dataanalysis, one of the most challenging things to do is to transform raw numbers into meaningful stories. GPT-4 stands out for its on-the-fly datavisualization capabilities. Next, we can initiate GPT-4’s instant dataanalysis feature.
A modular approach to Python plotly range slider code creationDall-E image: Impressionist interpretation of range slider in thick, rainbow colour Datavisualization skills are an essential component of quality dataanalysis. After a cursory view, I can see that some data cleaning is in order.
I started my career as a data analyst in a controlling department immediately following my graduation from the University of West Bohemia; I now work as a data scientist providing consultancy services for a range of different fields. The dataanalysis itself is the fun part. […].
In this blog, we will share the list of leading data science conferences across the world to be held in 2023. This will help you to learn and grow your career in data science, AI and machine learning. Top data science conferences 2023 in different regions of the world 1. PAW Climate and Deep Learning World.
Accordingly, Data Analysts use various tools for DataAnalysis and Excel is one of the most common. Significantly, the use of Excel in DataAnalysis is beneficial in keeping records of data over time and enabling datavisualization effectively. Let’s find out in the blog!
However, with the ever-increasing volume and complexity of data, it’s essential to have an effective data navigation system to optimize your BI strategy. Layered navigation is a powerful tool that can improve your BI strategy by providing better access to relevant data and insights.
In this blog, we’ll dive deep into what makes GPT-4o special, how it’s trained, its performance, key features, API comparisons, advanced use cases, and finally, why this model is a game-changer. Advanced DataAnalysis GPT-4o’s dataanalysis capabilities are robust.
How will datavisualization evolve in the era of AI/ML? The challenge is to move beyond these unintelligent dashboards to a genuinely transformative visual analytics solution that harnesses the power of AI/ML. While AI is rapidly evolving, it is ironic that business users are still using “dumb” dashboards.
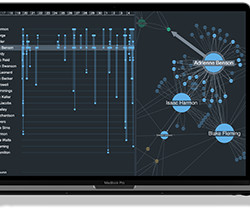
In this blog post, Ill show how effective log datavisualization improves your enterprise observability workflows. Youll see how KronoGraph, our timeline visualization SDK , can work alongside your log table, or replace it entirely. With KronoGraph log datavisualization, observing log sources becomes instantaneous.
We organize all of the trending information in your field so you don't have to. Join 17,000+ users and stay up to date on the latest articles your peers are reading.
You know about us, now we want to get to know you!
Let's personalize your content
Let's get even more personalized
We recognize your account from another site in our network, please click 'Send Email' below to continue with verifying your account and setting a password.


Let's personalize your content