This site uses cookies to improve your experience. To help us insure we adhere to various privacy regulations, please select your country/region of residence. If you do not select a country, we will assume you are from the United States. Select your Cookie Settings or view our Privacy Policy and Terms of Use.
Cookie Settings
Cookies and similar technologies are used on this website for proper function of the website, for tracking performance analytics and for marketing purposes. We and some of our third-party providers may use cookie data for various purposes. Please review the cookie settings below and choose your preference.
Used for the proper function of the website
Used for monitoring website traffic and interactions
Cookie Settings
Cookies and similar technologies are used on this website for proper function of the website, for tracking performance analytics and for marketing purposes. We and some of our third-party providers may use cookie data for various purposes. Please review the cookie settings below and choose your preference.
Strictly Necessary: Used for the proper function of the website
Performance/Analytics: Used for monitoring website traffic and interactions
In this blog, we will discuss exploratorydataanalysis, also known as EDA, and why it is important. We will also be sharing code snippets so you can try out different analysis techniques yourself. This can be useful for identifying patterns and trends in the data.
ArticleVideo Book This article was published as a part of the Data Science Blogathon Hi all, this is my first blog hope you all like. The post Performing ExploratoryDataAnalysis with SAS and Python appeared first on Analytics Vidhya.
Models like ChatGPT and LLama can generate text and code, perform exploratorydataanalysis, and automate documentation, which introduces countless opportunities for data science efficiencies. Generative AI (GenAI) has undoubtedly taken the spotlight as this years defining innovation.
As we have to be methodical about it, we’ll quickly see that we… Read the full blog for free on Medium. Join thousands of data leaders on the AI newsletter. Join over 80,000 subscribers and keep up to date with the latest developments in AI. From research to projects and ideas.
Source: Stephen Wolfram Writings Read this blog to Master ChatGPT cheatsheet 2. Here are some examples of how you can use the Noteable Notebook plugin for ChatGPT: ExploratoryDataAnalysis (EDA): You can use the plugin to generate descriptive statistics, create visualizations, and identify patterns in your data.
In this blog, we will explore the top 7 blogs of 2023 that have been instrumental in disseminating detailed and updated information in these dynamic fields. These blogs stand out not just for their depth of content but also for their ability to make complex topics accessible to a broader audience.
Making visualizations is one of the finest ways for data scientists to explain dataanalysis to people outside the business. Exploratorydataanalysis can help you comprehend your data better, which can aid in future data preprocessing. ExploratoryDataAnalysis What is EDA?
For those doing exploratorydataanalysis on tabular data: there is Sketch, a code-writing assistant that seamlessly integrates bits of your dataframes into promptsI’ve made this map using Sketch, Jupyter, Geopandas, and Keplergl For us, data professionals, AI advancements bring new workflows and enhance our toolset.
I also have created a Github for all code in this blog. I discuss why I went from five to two plot types in my preliminary EDA. The GitHub… Continue reading on MLearning.ai »
7 types of statistical distributions with practical examples Statistical distributions help us understand a problem better by assigning a range of possible values to the variables, making them very useful in data science and machine learning. Here are 7 types of distributions with intuitive examples that often occur in real-life data.
In this practical Kaggle notebook, I went through the basic techniques to work with time-series data, starting from data manipulation, analysis, and visualization to understand your data and prepare it for and then using statistical, machine, and deep learning techniques for forecasting and classification.
It involves exploratorydataanalysis, data cleansing, selecting the optimal set of independent variables, picking the most appropriate algorithm, implementing it efficiently, fine-tuning the parameters to predict the outcome more accurately, and a long list of other elements. From research to projects and ideas.
For data scrapping a variety of sources, such as online databases, sensor data, or social media. Cleaning data: Once the data has been gathered, it needs to be cleaned. This involves removing any errors or inconsistencies in the data.
Summary: Python simplicity, extensive libraries like Pandas and Scikit-learn, and strong community support make it a powerhouse in DataAnalysis. It excels in data cleaning, visualisation, statistical analysis, and Machine Learning, making it a must-know tool for Data Analysts and scientists. Why Python?
From this project, I saw a really great post from Darragh Murray about the importance of exploratorydataanalysis. Over the years I’ve been asked many times about how one becomes a better data analyst. The importance of exploratorydataanalysis: Exploring the first B2VB challenge. Inspiration.
From this project, I saw a really great post from Darragh Murray about the importance of exploratorydataanalysis. Over the years I’ve been asked many times about how one becomes a better data analyst. The importance of exploratorydataanalysis: Exploring the first B2VB challenge. Inspiration.
Some projects may necessitate a comprehensive LLMOps approach, spanning tasks from data preparation to pipeline production. ExploratoryDataAnalysis (EDA) Data collection: The first step in LLMOps is to collect the data that will be used to train the LLM.
Photo by Juraj Gabriel on Unsplash Dataanalysis is a powerful tool that helps businesses make informed decisions. In today’s blog, we will explore the Netflix dataset using Python and uncover some interesting insights. Submission Suggestions Netflix DataAnalysis using Python was originally published in MLearning.ai
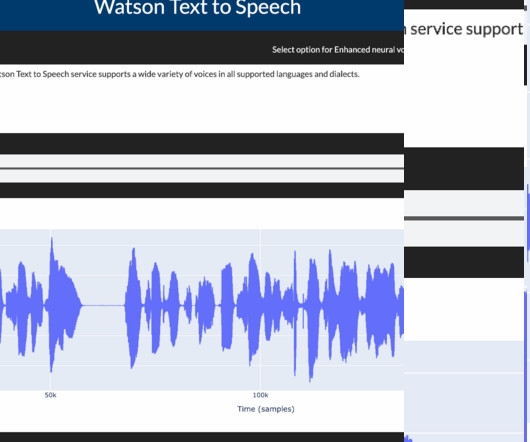
Text to Speech Dash app IBM Watson’s text-to-speech model is built using machine learning techniques and deep neural networks, trained on large amounts of speech and text data. This blog gives an overview of how to convert text data into speech and how to control speech rate & voice pitch using Watson Speech libraries.
You should be comfortable working with data structures, algorithms, and libraries like NumPy, Pandas, and TensorFlow. DataAnalysis Skills : To work with LLMs effectively, you should be comfortable with dataanalysis techniques. will then work on Langchain and Haystack to build an end to end LLM applications.
Recognizing the importance of HDB, in this blog we will delve deep to understand Singapore’s HDB resale prices based on a publicly available dataset using data-driven approaches. ExploratoryDataAnalysis Next, we will create visualizations to uncover some of the most important information in our data.
[link] Text classification is one of the most used NLP tasks for several use cases like email spam filtering, tagging, and classifying content, blogs, metadata, etc. In this blog, you will walk through the steps of building several ML and Deep learning-based models using the Watson NLP library. Dataframe head 2.
For access to the data used in this benchmark notebook, sign up for the competition here. KG 2 bfaiol.wav nonword_repetition chav KG 3 ktvyww.wav sentence_repetition ring the bell on the desk to get her attention 2 4 htfbnp.wav blending kite KG We'll join these datasets together to help with our exploratorydataanalysis.
This includes: Supporting Snowflake External OAuth configuration Leveraging Snowpark for exploratorydataanalysis with DataRobot-hosted Notebooks and model scoring. ExploratoryDataAnalysis After we connect to Snowflake, we can start our ML experiment. Learn more about Snowflake External OAuth.
Every day, new research and new information flood our technical newsletter subscriptions and our favorite technical blogs. Everybody is talking about ChatGPT, BARD, and Large Language Models (LLMs). I am personally liking this scenario. Task Orientation How were we doing machine learning almost a year ago? In fact, even today.
According to a report from Statista, the global big data market is expected to grow to over $103 billion by 2027, highlighting the increasing importance of data handling practices. Key Takeaways Data preprocessing is crucial for effective Machine Learning model training. During EDA, you can: Check for missing values.
Because most of the students were unfamiliar with machine learning (ML), they were given a brief tutorial illustrating how to set up an ML pipeline: how to conduct exploratorydataanalysis, feature engineering, model building, and model evaluation, and how to set up inference and monitoring.
By analyzing the sentiment of users towards certain products, services, or topics, sentiment analysis provides valuable insights that empower businesses and organizations to make informed decisions, gauge public opinion, and improve customer experiences. It ensures that the data used in analysis or modeling is comprehensive and comprehensive.
ExploratoryDataAnalysis(EDA)on Biological Data: A Hands-On Guide Unraveling the Structural Data of Proteins, Part II — ExploratoryDataAnalysis Photo from Pexels In a previous post, I covered the background of this protein structure resolution data set, including an explanation of key data terminology and details on how to acquire the data.
Introduction Data visualisation plays a crucial role in DataAnalysis by transforming complex datasets into insightful, easy-to-understand visuals. Python data visualisation libraries offer powerful visualisation tools , ranging from simple charts to interactive dashboards.
Today’s question is, “What does a data scientist do.” ” Step into the realm of data science, where numbers dance like fireflies and patterns emerge from the chaos of information. In this blog post, we’re embarking on a thrilling expedition to demystify the enigmatic role of data scientists.
If your dataset is not in time order (time consistency is required for accurate Time Series projects), DataRobot can fix those gaps using the DataRobot Data Prep tool , a no-code tool that will get your data ready for Time Series forecasting. Prepare your data for Time Series Forecasting. Perform exploratorydataanalysis.
Comet is an MLOps platform that offers a suite of tools for machine-learning experimentation and dataanalysis. It is designed to make it easy to track and monitor experiments and conduct exploratorydataanalysis (EDA) using popular Python visualization frameworks. What is Comet?
This comprehensive blog outlines vital aspects of Data Analyst interviews, offering insights into technical, behavioural, and industry-specific questions. It covers essential topics such as SQL queries, data visualization, statistical analysis, machine learning concepts, and data manipulation techniques.
Learn how Data Scientists use ChatGPT, a potent OpenAI language model, to improve their operations. ChatGPT is essential in the domains of natural language processing, modeling, dataanalysis, data cleaning, and data visualization. It facilitates exploratoryDataAnalysis and provides quick insights.
It entails developing computer programs that can improve themselves on their own based on expertise or data. The following blog will focus on Unsupervised Machine Learning Models focusing on the algorithms and types with examples. Therefore, it mainly deals with unlabelled data.
Data storage : Store the data in a Snowflake data warehouse by creating a data pipe between AWS and Snowflake. Data Extraction, Preprocessing & EDA : Extract & Pre-process the data using Python and perform basic ExploratoryDataAnalysis. The data is in good shape.
Data Science for CS Students can be an outstanding career choice that you can pursue as a Computer Science Engineer. However, how do you transition to a career in Data Science as a CS student? Let’s find out from the blog! Why Transition from Computer Science to Data Science?
Comet has another noteworthy feature: it allows us to conduct exploratorydataanalysis. To acquire a deeper knowledge of the dataset and undertake exploratorydataanalysis, the train.head() function is frequently used in conjunction with other methods such as train.info() and train.describe().
Afterwards, we will visualize the data we have obtained on the map using the Heatmap. After the visualization, he conducts an exploratorydataanalysis study about the concussions experienced, but briefly summarizing the severity of the experienced situations. df['YearMonth'] = df['Date'].apply(lambda
And importantly, starting naively annotating data might become a quick solution rather than thinking about how to make uses of limited labels if extracting data itself is easy and does not cost so much. The post How to tackle lack of data: an overview on transfer learning appeared first on Data Science Blog.
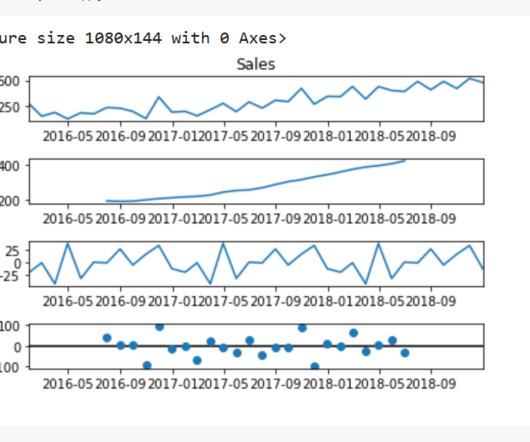
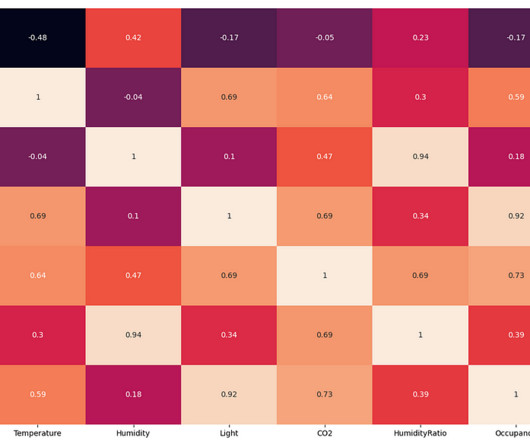
The exploratorydataanalysis found that the change in room temperature, CO levels, and light intensity can be used to predict the occupancy of the room in place of humidity and humidity ratio. We will also be looking at the correlation between the variables.
These communities will help you to be updated in the field, because there are some experienced data scientists posting the stuff, or you can talk with them so they will also guide you in your journey. DataAnalysis After learning math now, you are able to talk with your data.
We organize all of the trending information in your field so you don't have to. Join 17,000+ users and stay up to date on the latest articles your peers are reading.
You know about us, now we want to get to know you!
Let's personalize your content
Let's get even more personalized
We recognize your account from another site in our network, please click 'Send Email' below to continue with verifying your account and setting a password.


Let's personalize your content