This site uses cookies to improve your experience. To help us insure we adhere to various privacy regulations, please select your country/region of residence. If you do not select a country, we will assume you are from the United States. Select your Cookie Settings or view our Privacy Policy and Terms of Use.
Cookie Settings
Cookies and similar technologies are used on this website for proper function of the website, for tracking performance analytics and for marketing purposes. We and some of our third-party providers may use cookie data for various purposes. Please review the cookie settings below and choose your preference.
Used for the proper function of the website
Used for monitoring website traffic and interactions
Cookie Settings
Cookies and similar technologies are used on this website for proper function of the website, for tracking performance analytics and for marketing purposes. We and some of our third-party providers may use cookie data for various purposes. Please review the cookie settings below and choose your preference.
Strictly Necessary: Used for the proper function of the website
Performance/Analytics: Used for monitoring website traffic and interactions
A Data Product can take various forms, depending on the domain’s requirements and the data it manages. It could be a curated dataset, a machine learning model, an API that exposes data, a real-time data stream, a datavisualization dashboard, or any other data-related asset that provides value to the organization.
Data is an essential component of any business, and it is the role of a data analyst to make sense of it all. Power BI is a powerful datavisualization tool that helps them turn raw data into meaningful insights and actionable decisions. Check out this course and learn Power BI today!
According to Forbes, Almost eighty-thousand scientific studies attest that visual images promote retention. Research has shown that many people learn best when they see a story or information depicted in an image.
In this tutorial for JavaScript developers, I’ll demonstrate how to integrate our graph visualization SDKs with Neo4j to create a powerful datavisualization web app. FREE: Start your KeyLines trial today Visualize your data! Right – let’s start building our datavisualization web app!
Data science myths are one of the main obstacles preventing newcomers from joining the field. In this blog, we bust some of the biggest myths shrouding the field. The US Bureau of Labor Statistics predicts that data science jobs will grow up to 36% by 2031.
It’s a universal programming language that finds application in different technologies like AI, ML, Big Data and others. In this blog, we are going to explore details about a career in Python and what are the new Python jobs for freshers. Model Development: Use libraries such as TensorFlow, Keras, PyTorch, scikit-learn, etc.,
js and Tableau Data science, data analytics and IBM Practicing data science isn’t without its challenges. There can be fragmented data, a short supply of data science skills and rigid IT standards for training and deployment.
Summary: Business Intelligence Analysts transform raw data into actionable insights. They use tools and techniques to analyse data, create reports, and support strategic decisions. Key skills include SQL, datavisualization, and business acumen. Introduction We are living in an era defined by data.
It is the process of converting raw data into relevant and practical knowledge to help evaluate the performance of businesses, discover trends, and make well-informed choices. Data gathering, data integration, datamodelling, analysis of information, and datavisualization are all part of intelligence for businesses.
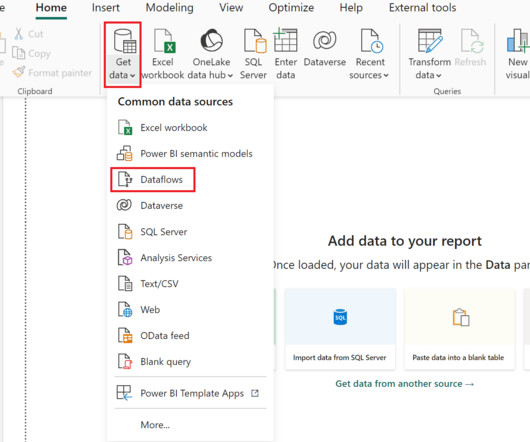
Power BI’s, and now Fabric’s ability to centralize dashboards and Semantic Models (formerly datasets) so that reporting is easily accessible and data can be shared without unnecessarily duplicating is second to none in the business intelligence product realm. What are Dataflows, and Why are They So Great?
Two of the platforms that we see emerging as a popular combination of data warehousing and business intelligence are the Snowflake Data Cloud and Power BI. Debuting in 2015, Power BI has undergone meaningful updates that have made it a leader not just in datavisualization, but in the business intelligence space as well.
Summary: This blog dives into the most promising Power BI projects, exploring advanced datavisualization, AI integration, IoT & blockchain analytics, and emerging technologies. Discover best practices for successful implementation and propel your organization towards data-driven success.
Furthermore, a study indicated that 71% of organisations consider Data Analytics a critical factor for enhancing their business performance. This blog will explore what Business Intelligence tools are, their functionalities, real-world applications, and address common questions surrounding them.
In this blog post, I'll describe my analysis of Tableau's history to drive analytics innovation—in particular, I've identified six key innovation vectors through reflecting on the top innovations across Tableau releases. April 2018), which focused on users who do understand joins and curating federated data sources.
Two streams ran at speed in parallel—stakeholder interviews leading to a UI wire-frame design, and development of the UI in React alongside design and population of the datamodel. What possibilities did this datavisualization project highlight?
In this blog, we will cover what tables and pivot tables are, the advantages and limitations of each, and the factors to consider when choosing which element to use. At the end of this blog, you will have a firm understanding of both elements and how to utilize each in your day-to-day data exploration. How do you Decide?
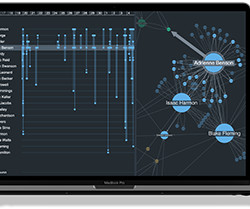
Most successful investigators bring datavisualization into their due diligence workflow. Graph visualization (link analysis) and ‘pattern-of-life’ timelines are essential for compliance because they put users in control of the investigation, giving them an intuitive way to navigate and organize the information they’re exploring.
Network visualization plays an important part in the anti-fraud management cycle In this blog post, we’ll look at credit card fraud and the graph and timeline visualization techniques that uncover the story behind the data. In our visualdatamodel, nodes represent people and merchants, linked by transactions.
Proficient in programming languages like Python or R, data manipulation libraries like Pandas, and machine learning frameworks like TensorFlow and Scikit-learn, data scientists uncover patterns and trends through statistical analysis and datavisualization. DataVisualization: Matplotlib, Seaborn, Tableau, etc.
Introduction Business Intelligence (BI) architecture is a crucial framework that organizations use to collect, integrate, analyze, and present business data. This architecture serves as a blueprint for BI initiatives, ensuring that data-driven decision-making is efficient and effective. time, product) and facts (e.g.,
Key Features of Power BI: Power BI is a powerful business intelligence tool developed by Microsoft that enables users to visualize and analyze data from various sources. It offers a wide range of features that make it a popular choice for data professionals, analysts, and organizations. appeared first on Pickl AI.
It uses advanced tools to look at raw data, gather a data set, process it, and develop insights to create meaning. Areas making up the data science field include mining, statistics, data analytics, datamodeling, machine learning modeling and programming. appeared first on IBM Blog.
Tableau can help Data Scientists generate graphs, charts, maps and data-driven stories, etc for purpose of visualisation and analysing data. But What is Tableau for Data Science and what are its advantages and disadvantages? Let’s read the blog to find out! How Professionals Can Use Tableau for Data Science?
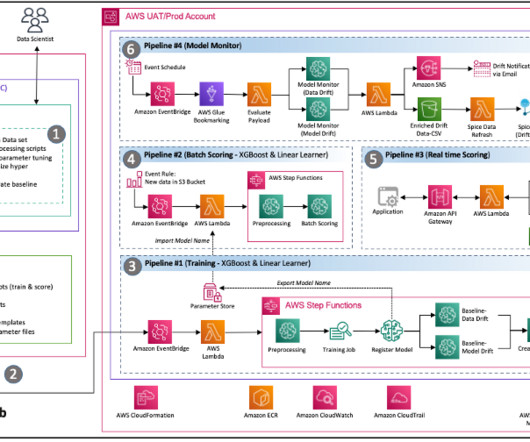
Experiment notebooks Purpose : The customer’s data science team wanted to experiment with various datasets and multiple models to come up with the optimal features, using those as further inputs to the automated pipeline. He holds the AWS AI/ML Specialty certification and authors technical blogs on AI/ML services and solutions.
By changing the cost structure of collecting data, it increased the volume of data stored in every organization. Additionally, Hadoop removed the requirement to model or structure data when writing to a physical store. You did not have to understand or prepare the data to get it into Hadoop, so people rarely did.
Learn how Data Scientists use ChatGPT, a potent OpenAI language model, to improve their operations. ChatGPT is essential in the domains of natural language processing, modeling, data analysis, data cleaning, and datavisualization. This will enhance the data preparation stage of machine learning.
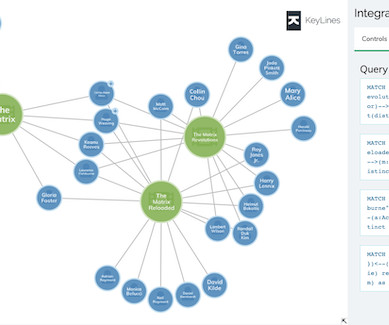
In this blog post, I’ll outline three simple steps to create an interactive React Neo4j visualization tool. We’ll use ReGraph, our graph visualization SDK for React, and the StackOverflow sample dataset from the Neo4j Sandbox, but the approach can be adapted for any connected dataset stored in any kind of Neo4j instance.
That’s why our datavisualization SDKs are database agnostic: so you’re free to choose the right stack for your application. Multi-model databases combine graphs with two other NoSQL datamodels – document and key-value stores. This blog post by Memgraph gives a good overview of the most popular options.
In this blog post, I'll describe my analysis of Tableau's history to drive analytics innovation—in particular, I've identified six key innovation vectors through reflecting on the top innovations across Tableau releases. April 2018), which focused on users who do understand joins and curating federated data sources.
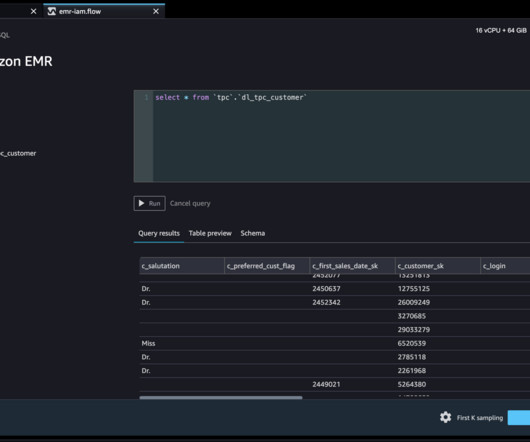
The capabilities of Lake Formation simplify securing and managing distributed data lakes across multiple accounts through a centralized approach, providing fine-grained access control. Solution overview We demonstrate this solution with an end-to-end use case using a sample dataset, the TPC datamodel. Choose Open Studio.
With a focus on datavisualization and behavioral analytics, Ive found Sigmas speed to insight, flexible platform, and intuitive UI to be game-changers for my work. In this blog, Ill share what we learned, my feedback on the experience, and who in your organization should consider attending future workshops!
Development - High quality model training, fine-tuning or prompt tuning, validation and deployment with CI/CD for ML. Application - Bringing business value to live applications through a real-time application pipeline that handles requests, data, model and validations. However, GPUs are scarce and expensive.
The modern data stack refers to the collection of tools and platforms that have been developed to provide scalable and economical solutions to work with large volumes of data. The modern data stack is important because its suite of tools is designed to solve all of the core data challenges companies face.
This blog post explores how graph visualization brings digital twins to life. Graph visualization SDKs would have been a huge asset to those projects. To prove this, I built my own digital twin using the KeyLines graph visualization toolkit. What is a digital twin? What comes to mind when you think of a digital twin?
But raw data alone isn’t enough to gain valuable insights. This is where data warehouses come in – powerful tools designed to transform raw data into actionable intelligence. This blog delves into the world of data warehouses, exploring their functionality, key features, and the latest innovations.
He works on pioneering solutions for various industries using statistical modeling and machine learning techniques. His interest includes generative models and sequential datamodeling. Her research interest includes model interpretability, causal analysis, human-in-the-loop AI and interactive datavisualization.
This means we can harness AI to help tackle the most common and pressing data and analytics challengesincluding fragmented data landscapes, a lack of trust in data, overlooked insights, and the reusability of analytics assetsin one platform. Learn more about how were addressing these challenges in our blog, What is Tableau Next?
This means we can harness AI to help tackle the most common and pressing data and analytics challenges—including fragmented data landscapes, a lack of trust in data, overlooked insights, and the reusability of analytics assets—in one platform. and see Tableau Einstein in action by watching our keynote at Dreamforce 2024.
The ability to analyze and derive insights from vast amounts of data empowers businesses to make informed choices, optimize processes, and drive growth. In this blog, we will delve into four key types of analytics – Descriptive Analytics, Diagnostic Analytics, Predictive Analytics, and Prescriptive Analytics. Key Features: i.
Summary: The blog delves into the 2024 Data Analyst career landscape, focusing on critical skills like Data Visualisation and statistical analysis. It identifies emerging roles, such as AI Ethicist and Healthcare Data Analyst, reflecting the diverse applications of Data Analysis.
From the sheer volume of information to the complexity of data sources and the need for real-time insights, HCLS companies constantly need to adapt and overcome these challenges to stay ahead of the competition. In this blog, we’ll explore 10 pressing data analytics challenges and discuss how Sigma and Snowflake can help.
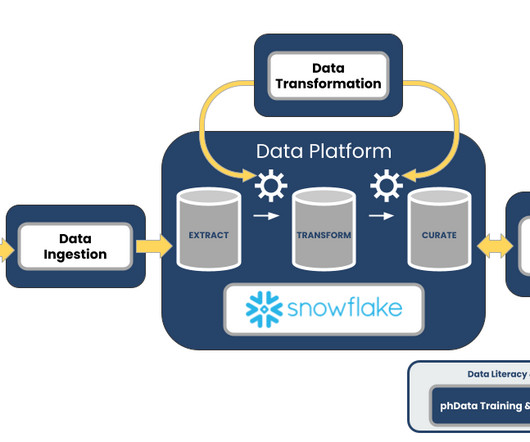
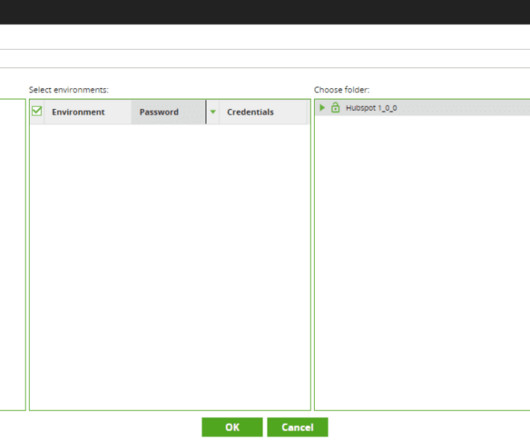
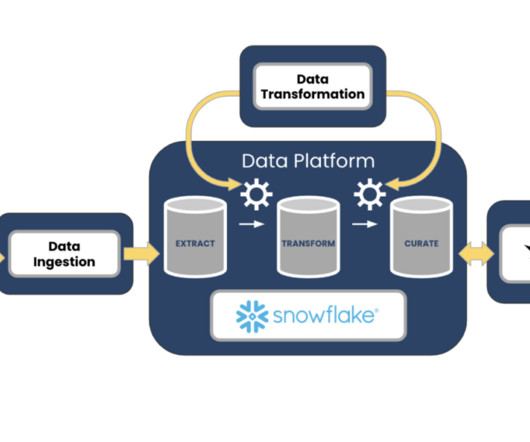
Data literacy is increasing fast, and team members capable of administrating a business unit’s transactional system can also perform the cloud ETL of that system data to a Snowflake database via Matillion. In this blog post, we’ll discuss use cases for Zero-Code Development Life Cycle (ZDLC) in Matillion.
In the realm of Data Intelligence, the blog demystifies its significance, components, and distinctions from Data Information, Artificial Intelligence, and Data Analysis. ” This notion underscores the pivotal role of data in today’s dynamic landscape. What is Data Intelligence in Data Science?
Enter dbt dbt provides SQL-centric transformations for your datamodeling and transformations, which is efficient for scrubbing and transforming your data while being an easy skill set to hire for and develop within your teams. This can be critical to maintaining stakeholder buy-in and continued funding.
We organize all of the trending information in your field so you don't have to. Join 17,000+ users and stay up to date on the latest articles your peers are reading.
You know about us, now we want to get to know you!
Let's personalize your content
Let's get even more personalized
We recognize your account from another site in our network, please click 'Send Email' below to continue with verifying your account and setting a password.


Let's personalize your content