This site uses cookies to improve your experience. To help us insure we adhere to various privacy regulations, please select your country/region of residence. If you do not select a country, we will assume you are from the United States. Select your Cookie Settings or view our Privacy Policy and Terms of Use.
Cookie Settings
Cookies and similar technologies are used on this website for proper function of the website, for tracking performance analytics and for marketing purposes. We and some of our third-party providers may use cookie data for various purposes. Please review the cookie settings below and choose your preference.
Used for the proper function of the website
Used for monitoring website traffic and interactions
Cookie Settings
Cookies and similar technologies are used on this website for proper function of the website, for tracking performance analytics and for marketing purposes. We and some of our third-party providers may use cookie data for various purposes. Please review the cookie settings below and choose your preference.
Strictly Necessary: Used for the proper function of the website
Performance/Analytics: Used for monitoring website traffic and interactions
Data is an essential component of any business, and it is the role of a data analyst to make sense of it all. PowerBI is a powerfuldata visualization tool that helps them turn raw data into meaningful insights and actionable decisions. How does a data analyst use PowerBI?
When thinking about PowerBI , the platform’s visuals and report side immediately come to mind. While the front-end report visuals are important and the most visible to end users, a lot goes on behind the scenes that contribute heavily to the end product, including datamodeling. What is DataModeling?
Row-level security is a powerfuldata governance capability across many business intelligence platforms, and PowerBI is no exception. Learning how to implement row-level security is critical for any PowerBI developer hoping to add an extra layer of security to their reports and datasets.
It offers full BI-Stack Automation, from source to data warehouse through to frontend. It supports a holistic datamodel, allowing for rapid prototyping of various models. It also supports a wide range of data warehouses, analytical databases, data lakes, frontends, and pipelines/ETL.
How to Optimize PowerBI and Snowflake for Advanced Analytics Spencer Baucke May 25, 2023 The world of business intelligence and data modernization has never been more competitive than it is today. Table of Contents Why Discuss Snowflake & PowerBI?
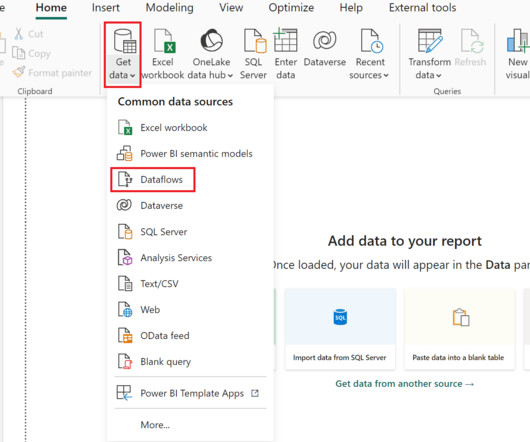
PowerBI Desktop enables the connection and retrieval of data from various sources, followed by data transformation using Power Query. To address this challenge, Microsoft introduced Dataflows within the PowerBI service. What are Dataflows in PowerBI?
New big data architectures and, above all, data sharing concepts such as Data Mesh are ideal for creating a common database for many data products and applications. The Event Log DataModel for Process Mining Process Mining as an analytical system can very well be imagined as an iceberg.
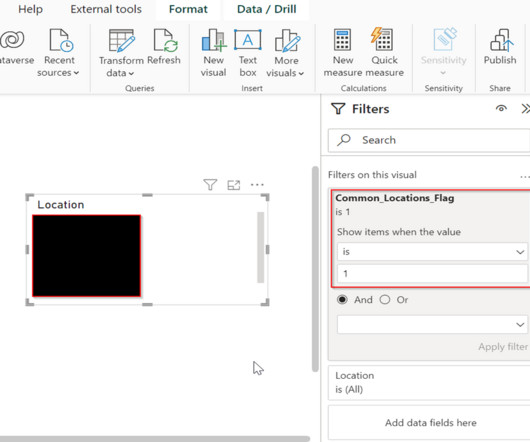
In this blog, we will delve into real-world applications of Measure as Flag , exploring various types of measures. Additionally, we will provide a distinction between measures and calculated columns in datamodeling and visualization. The measure name must be unique throughout the entire model. Calculated Column 1.
In this blog, I will walk you through what Field Parameters are and why they are important, and finally, I’ll show you how to use them with an example. By the end of this blog, you should have a decent working knowledge of how Field Parameters can make your life as a PowerBI developer much easier.
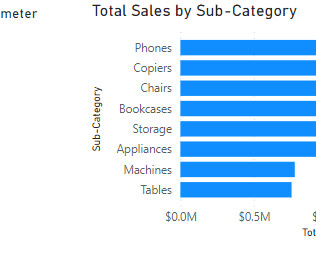
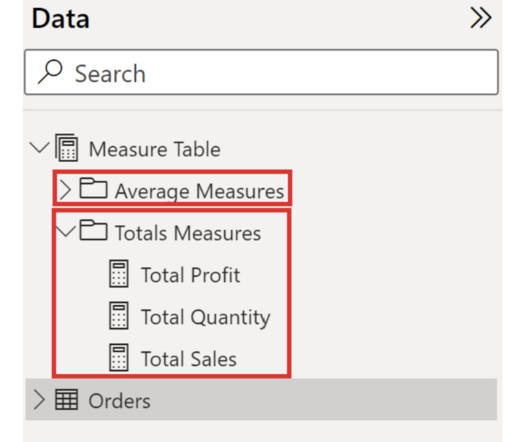
This blog was written by Spencer Baucke and updated for 2023 by Gavin Pedersen. Letting your PowerBIdatamodel get disorganized is a feeling every PowerBI developer knows all too well, and it’s something that can occur very quickly when developing. What’s a Measures Table From PowerBI?
We at phData have written extensively about creating centralized data products in PowerBI. However, we have not yet touched on dataflows and the importance of this unique type of data product. Most PowerBI developers are familiar with Power Query , Which is the data transformation layer of PowerBI.
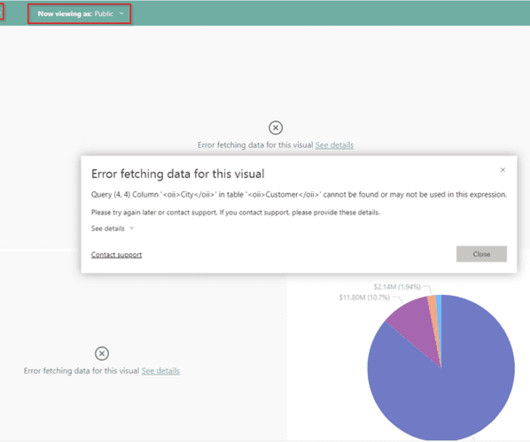
As PowerBI developers, we should be familiar with functionalities within PowerBI that allow for the implementation of various levels of data security; the most common example may be Row-Level Security (RLS). Perhaps this is because it is not a native feature readily available within PowerBI.
Summary: Counting rows is a fundamental task in PowerBI that requires careful consideration. This blog explores how to get total number of rows in power query. Understanding PowerBI and Its Importance PowerBI is a suite of business analytics tools that allows users to analyze data and share insights.
PowerBI Heatmap: Heatmap in PowerBI refers to the type of custom visualisation that businesses analysts utilise for showcasing the relationship between two variables on a map in different colour patches. It offers a wide range of features that make it a popular choice for data professionals, analysts, and organizations.
Using pre-production data during the development process of building a PowerBI dashboard is considered a best practice. Doing so avoids straining your production data environment and reserves those resources for dashboards that are actually being used by end-users. What can a Parameter for your Data Source Accomplish?
PowerBI Datamarts is one of the most exciting features that Microsoft has released for the Power Platform in recent years. If you need high-level information on what a PowerBI Datamart is and some example use cases, check out our other blog, What Are PowerBI Datamarts?
PowerBI is a versatile and scalable platform that combines self-service and enterprise business intelligence (BI) capabilities. It serves as a comprehensive solution for connecting to diverse data sources and creating compelling visualizations. What is the SWITCH Function?
To get participants started, we published a blog post outlining some commonly used open Earth observation datasets. QGIS, Microsoft's PowerBI, Tableau, and Jupyter notebooks also facilitated many interesting visualizations, particularly for solvers with less programming experience.
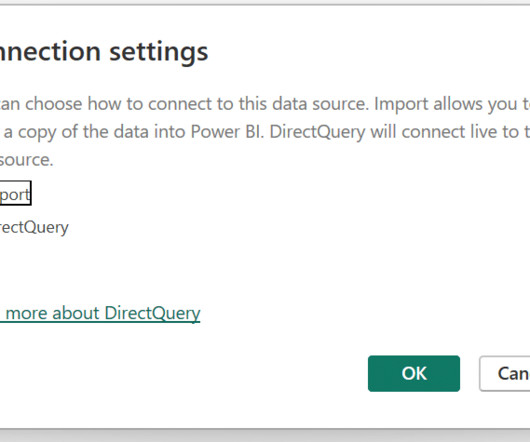
When connecting to data in PowerBI, you need to choose whether you want to use Import or Direct Query mode to connect to your data. Using the Import method, PowerBI captures and caches a snapshot of your data in PowerBI. What is PowerBI Direct Query?
To pursue a data science career, you need a deep understanding and expansive knowledge of machine learning and AI. js and Tableau Data science, data analytics and IBM Practicing data science isn’t without its challenges.
Business Intelligence Analysts are the skilled artisans who transform this raw data into valuable insights, empowering organizations to make strategic decisions and stay ahead of the curve. Key Takeaways BI Analysts convert data into actionable insights for strategic business decisions.
According to a report by Gartner, organizations that utilize BI tools can improve their operational efficiency and gain competitive advantages over rivals. Furthermore, a study indicated that 71% of organisations consider Data Analytics a critical factor for enhancing their business performance.
With organisations prioritising efficiency, sustainability, and data-backed decision-making, Operations Analysts now play a pivotal role in streamlining processes and optimising performance. They bridge the gap between data insights and actionable strategies, ensuring businesses stay competitive.
It is the process of converting raw data into relevant and practical knowledge to help evaluate the performance of businesses, discover trends, and make well-informed choices. Data gathering, data integration, datamodelling, analysis of information, and data visualization are all part of intelligence for businesses.
Summary: This blog delves into hierarchies in dimensional modelling, highlighting their significance in data organisation and analysis. Real-world examples illustrate their application, while tools and technologies facilitate effective hierarchical data management in various industries.
Tableau can help Data Scientists generate graphs, charts, maps and data-driven stories, etc for purpose of visualisation and analysing data. But What is Tableau for Data Science and what are its advantages and disadvantages? Let’s read the blog to find out!
Introduction Business Intelligence (BI) architecture is a crucial framework that organizations use to collect, integrate, analyze, and present business data. This architecture serves as a blueprint for BI initiatives, ensuring that data-driven decision-making is efficient and effective. time, product) and facts (e.g.,
Data Engineering: Laying the Foundation for Data Success While Data Science deals with data analysis and insights, Data Engineering focuses on the design, construction, and maintenance of robust data pipelines and infrastructure. Data Warehousing: Amazon Redshift, Google BigQuery, etc.
Summary: This blog discusses best practices for designing effective fact tables in dimensional models. Additionally, it addresses common challenges and offers practical solutions to ensure that fact tables are structured for optimal data quality and analytical performance.
Read Blogs: Crucial Statistics Interview Questions for Data Science Success. MongoDB is a NoSQL database that handles large-scale data and modern application requirements. MongoDB is a NoSQL database that uses a document-oriented datamodel. 2024’s top PowerBI interview questions simplified.
Data Mesh on Azure Cloud with Databricks and Delta Lake for Applications of Business Intelligence, Data Science and Process Mining. With the concept of Data Mesh you will be able to access all your organizational internal and external data sources once and provides the data as several datamodels for all your analytical applications.
Summary: This blog dives into the most promising PowerBI projects, exploring advanced data visualization, AI integration, IoT & blockchain analytics, and emerging technologies. Discover best practices for successful implementation and propel your organization towards data-driven success.
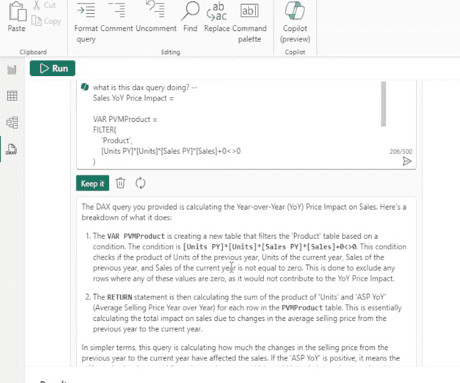
Among the various PowerBI tools available in the digital market to enable data-driven decision-making capabilities, PowerBI has emerged as a market leader. In this blog, we will focus on PowerBI DAX Copilot , a feature exclusively available on PowerBI Desktop.
We all know how easy it is to refresh a single table in PowerBI Desktop by right-clicking the table and selecting Refresh Data. However, in PowerBI Service, we can only refresh the entire semantic model, as there is no out-of-the-box solution for refreshing a single table.
Data engineering is all about collecting, organising, and moving data so businesses can make better decisions. Handling massive amounts of data would be a nightmare without the right tools. In this blog, well explore the best data engineering tools that make data work easier, faster, and more reliable.
We organize all of the trending information in your field so you don't have to. Join 17,000+ users and stay up to date on the latest articles your peers are reading.
You know about us, now we want to get to know you!
Let's personalize your content
Let's get even more personalized
We recognize your account from another site in our network, please click 'Send Email' below to continue with verifying your account and setting a password.


Let's personalize your content