This site uses cookies to improve your experience. To help us insure we adhere to various privacy regulations, please select your country/region of residence. If you do not select a country, we will assume you are from the United States. Select your Cookie Settings or view our Privacy Policy and Terms of Use.
Cookie Settings
Cookies and similar technologies are used on this website for proper function of the website, for tracking performance analytics and for marketing purposes. We and some of our third-party providers may use cookie data for various purposes. Please review the cookie settings below and choose your preference.
Used for the proper function of the website
Used for monitoring website traffic and interactions
Cookie Settings
Cookies and similar technologies are used on this website for proper function of the website, for tracking performance analytics and for marketing purposes. We and some of our third-party providers may use cookie data for various purposes. Please review the cookie settings below and choose your preference.
Strictly Necessary: Used for the proper function of the website
Performance/Analytics: Used for monitoring website traffic and interactions
Plots in datascience play a pivotal role in unraveling complex insights from data. Learn about 33 tools to visualize data with this blog In this blog post, we will delve into some of the most important plots and concepts that are indispensable for any data scientist.
Datascience bootcamps are intensive short-term educational programs designed to equip individuals with the skills needed to enter or advance in the field of datascience. They cover a wide range of topics, ranging from Python, R, and statistics to machine learning and data visualization.
In this blog, we will discuss exploratory data analysis, also known as EDA, and why it is important. The data analysis process enables analysts to gain insights into the data that can inform further analysis, modeling, and hypothesistesting. So, without any further ado let’s dive right in.
Summary: Mastering mathematics is crucial for excelling in DataScience. Introduction Mathematics plays a pivotal role in DataScience. The foundation of the DataScience field rests upon the bedrock of mathematical principles. Essential topics include statistics, linear algebra, calculus, and probability.
Mathematics and DataScience: its role and relevance Mathematics and DataScience are discussed in the same breath. The reason behind this unbreakable bond is the role of mathematical equations in DataScience. Why DataScience? 650% growth in the data domain since 2012.
This entry is a part of our Meet the Fellow blog series, which introduces and highlights Faculty Fellows who have recently joined CDS. Puli recently finished his PhD in Computer Science at NYU’s Courant Institute, advised by CDS Assistant Professor of Computer Science and DataScience Rajesh Ranganath.
DataScience is a popular as well as vast field; till date, there are a lot of opportunities in this field, and most people, whether they are working professionals or students, everyone want a transition in datascience because of its scope. How much to learn? What to do next?
Put more concretely, data analysis involves sifting through data, modeling it, and transforming it to yield information that guides strategic decision-making. For businesses, data analytics can provide highly impactful decisions with long-term yield. Data analysis methods are discussed in detail later in this blog.
Summary: Confused about DataScience course requirements? Learn how to assess courses and prepare for enrollment to launch your DataScience journey. The world runs on data. From targeted advertising to personalized healthcare, DataScience is revolutionizing every industry. Let’s Get Started !!!
Summary: DataScience appears challenging due to its complexity, encompassing statistics, programming, and domain knowledge. However, aspiring data scientists can overcome obstacles through continuous learning, hands-on practice, and mentorship. However, many aspiring professionals wonder: Is DataScience hard?
What is R in DataScience? As a programming language it provides objects, operators and functions allowing you to explore, model and visualise data. How is R Used in DataScience? R is a popular programming language and environment widely used in the field of datascience.
Summary: The blog explores the synergy between Artificial Intelligence (AI) and DataScience, highlighting their complementary roles in Data Analysis and intelligent decision-making. This article explores how AI and DataScience complement each other, highlighting their combined impact and potential.
With the expanding field of DataScience, the need for efficient and skilled professionals is increasing. Its efficacy may allow kids from a young age to learn Python and explore the field of DataScience. Its efficacy may allow kids from a young age to learn Python and explore the field of DataScience.
Summary: A Masters in DataScience in India prepares students for exciting careers in a growing field. Introduction In today’s data-driven world, DataScience is crucial across industries, transforming raw data into actionable insights. Why Pursue a Master’s in DataScience?
I have explained normal distribution in very simple words and with examples in the below blog. One of the most important applications is hypothesistesting. [I I am going to write a separate blog on hypothesistesting, but till then, you can refer attached link.]. you can refer to it for the introduction.
Together, data engineers, data scientists, and machine learning engineers form a cohesive team that drives innovation and success in data analytics and artificial intelligence. Their collective efforts are indispensable for organizations seeking to harness data’s full potential and achieve business growth.
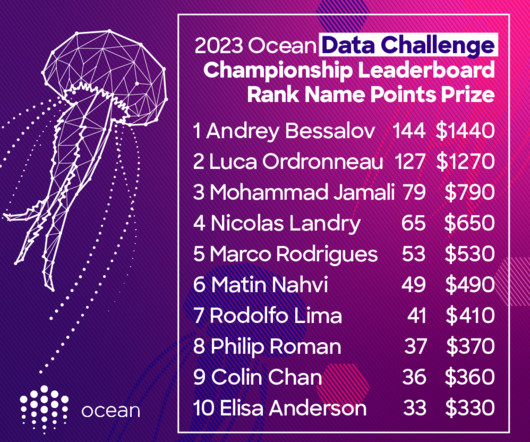
Our team behind Ocean Data Challenges concentrates on DataScience and is 1 of 3 concentration verticals (teams) within the Ocean Protocol core team. We are responsible for the Data Challenge Program, all related processes tied to the program & adjacent initiatives. Looking Forward The journey doesn’t end here!
Hey guys, in this blog we will see some of the most asked DataScience Interview Questions by interviewers in [year]. Datascience has become an integral part of many industries, and as a result, the demand for skilled data scientists is soaring. What is DataScience?
Demonstrate your case for 1st place in this year’s data challenge championship season. Introduction This blog introduces the kickoff of the 2024 Ocean Protocol Data Challenge Championship. The first Data Challenge of the year is live on Desights now and ends on Tuesday, Jan 30, 2024. ’24 continue to roll out regularly.
This principle is vital for accurate hypothesistesting and confidence interval estimation. Introduction Probability and statistics are fundamental in analysing data and making informed decisions. One crucial concept in these fields is the Central Limit Theorem (CLT), which plays a vital role in understanding data distributions.
Summary: Explore the difference between Null and Alternate Hypotheses in hypothesistesting. The Null Hypothesis assumes no effect, while the Alternate Hypothesis suggests a significant impact. Read Blog: Let’s Understand the Difference Between Data and Information. What is a Hypothesis?
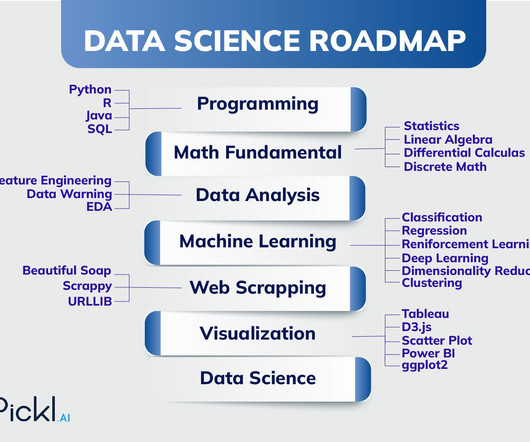
Summary: DataScience is becoming a popular career choice. Mastering programming, statistics, Machine Learning, and communication is vital for Data Scientists. A typical DataScience syllabus covers mathematics, programming, Machine Learning, data mining, big data technologies, and visualisation.
Companies are looking forward to hiring crème de la crème Data Scientists. This guide throws light on the roadmap to becoming a Data Scientist. Key Takeaways: DataScience is a multidisciplinary field bridging statistics, mathematics, and computer science to extract insights from data.
With more than 650% growth since 2012, DataScience has emerged as one of the most sought-after technologies. With the new developments in this domain, DataScience presents a picture of futuristic technology. A Data Scientist’s average salary in India is up to₹ 8.0 Data Scientist Salary in Hyderabad : ₹ 8.0
Summary : This blog provides a comprehensive overview of statistical tools for data-driven research. Researchers across disciplines will find valuable insights to enhance their Data Analysis skills and produce credible, impactful findings. Understanding these tools is fundamental for effective Data Analysis.
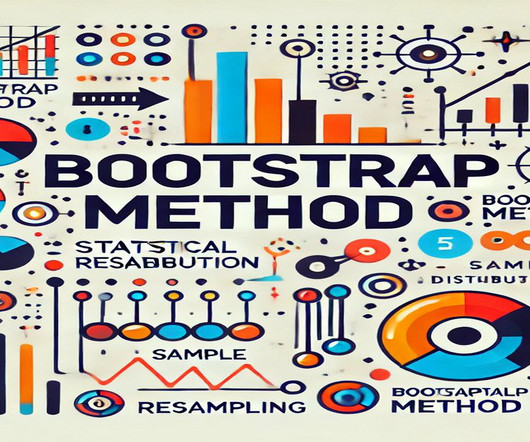
Summary: The Bootstrap Method is a versatile statistical technique used across various fields, including estimating confidence intervals, validating models in Machine Learning, conducting hypothesistesting, analysing survey data, and assessing financial risks. What is the Bootstrap Method?
This blog delves into the essence of learning AI from scratch, unravelling its significance in today’s dynamic landscape of innovation and opportunity. Utilise platforms like Kaggle to participate in datascience competitions and collaborate with fellow AI enthusiasts. Join Pickl.AI today and unlock your potential!
Her experience and knowledge in the field needs to be known and this blog, will help you to understand how to become a Statistician. Clean and preprocess data to ensure its quality and reliability. Experimental Design: Plan and execute experiments, ensuring proper randomization and control groups to gather meaningful data.
Statistics is an important part of DataScience where using Statistical Analysis, organisations can derive the value of the data input and evaluate meaningful conclusions. Accordingly, there are different types of statistical analysis techniques that are essential for application in various industries with a wide range of data.
Certainly, Data Scientists make use of different statistical modeling techniques that help in finding relationships between data. Focusing on the various statistical models in R with examples, the following blog will help you learn in detail about these techniques and enhance your knowledge. What is Statistical Modeling?
Introduction In the rapidly evolving field of Data Analysis , the choice of programming language can significantly impact the efficiency, accuracy, and scalability of data-driven projects. This blog will delve into the reasons why Python is essential for Data Analysis, highlighting its key features, libraries, and applications.
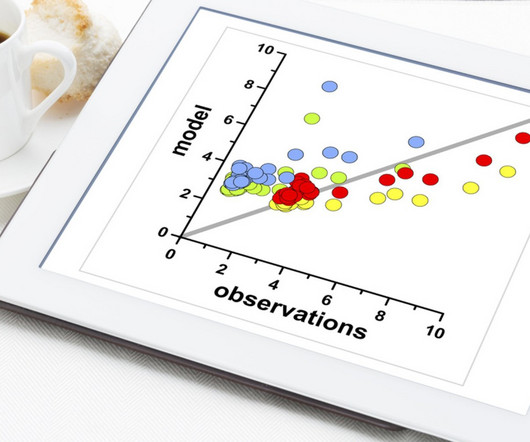
In Data Analysis, Statistical Modeling is essential for drawing meaningful conclusions and guiding decision-making. This blog aims to explain what Statistical Modeling is, highlight its key components, and explore its applications across various sectors. They are essential in scientific research for concluding limited data.
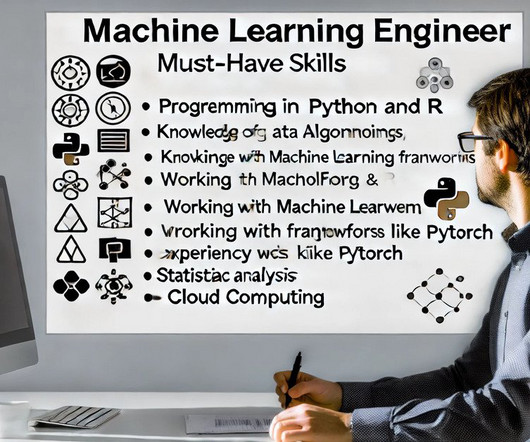
Summary: The blog discusses essential skills for Machine Learning Engineer, emphasising the importance of programming, mathematics, and algorithm knowledge. Understanding Machine Learning algorithms and effective data handling are also critical for success in the field. The global Machine Learning market was valued at USD 35.80
The career of a Data Analyst is highly lucrative today and with the right skills, your dream job is just around the corner. It is expected that the DataScience market will have more than 11 million job roles in India by 2030, opening up opportunities for you. Ensure that all projects are well-organized and easy to navigate.
The ability to analyze and derive insights from vast amounts of data empowers businesses to make informed choices, optimize processes, and drive growth. In this blog, we will delve into four key types of analytics – Descriptive Analytics, Diagnostic Analytics, Predictive Analytics, and Prescriptive Analytics.
Here are some important blogs for you related to statistics: Process and Types of HypothesisTesting in Statistics. Crucial Statistics Interview Questions for DataScience Success. You should definitely check out the best statistics books for datascience.
Introduction Data plays a crucial role in research, decision-making, and analysis. Understanding the types of data is essential for effective research. This blog will explore the differences between primary and secondary data. Key Takeaways Primary data is original and specific to research needs.
A well-structured syllabus for Big Data encompasses various aspects, including foundational concepts, technologies, data processing techniques, and real-world applications. This blog aims to provide a comprehensive overview of a typical Big Data syllabus, covering essential topics that aspiring data professionals should master.
This comprehensive blog outlines vital aspects of Data Analyst interviews, offering insights into technical, behavioural, and industry-specific questions. It covers essential topics such as SQL queries, data visualization, statistical analysis, machine learning concepts, and data manipulation techniques.
We organize all of the trending information in your field so you don't have to. Join 17,000+ users and stay up to date on the latest articles your peers are reading.
You know about us, now we want to get to know you!
Let's personalize your content
Let's get even more personalized
We recognize your account from another site in our network, please click 'Send Email' below to continue with verifying your account and setting a password.


Let's personalize your content