This site uses cookies to improve your experience. To help us insure we adhere to various privacy regulations, please select your country/region of residence. If you do not select a country, we will assume you are from the United States. Select your Cookie Settings or view our Privacy Policy and Terms of Use.
Cookie Settings
Cookies and similar technologies are used on this website for proper function of the website, for tracking performance analytics and for marketing purposes. We and some of our third-party providers may use cookie data for various purposes. Please review the cookie settings below and choose your preference.
Used for the proper function of the website
Used for monitoring website traffic and interactions
Cookie Settings
Cookies and similar technologies are used on this website for proper function of the website, for tracking performance analytics and for marketing purposes. We and some of our third-party providers may use cookie data for various purposes. Please review the cookie settings below and choose your preference.
Strictly Necessary: Used for the proper function of the website
Performance/Analytics: Used for monitoring website traffic and interactions
In this blog, we will explore the top 7 blogs of 2023 that have been instrumental in disseminating detailed and updated information in these dynamic fields. These blogs stand out not just for their depth of content but also for their ability to make complex topics accessible to a broader audience.
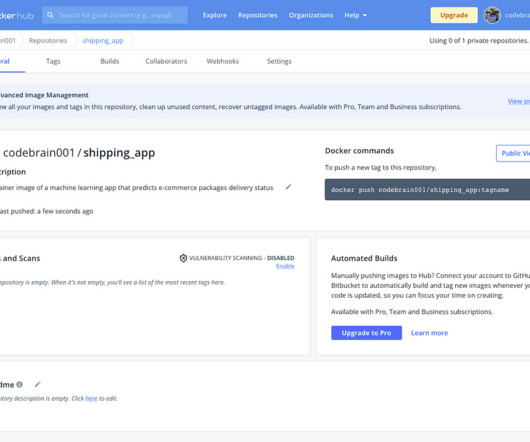
The goal of data cleaning, the data cleaning process, selecting the best programming language and libraries, and the overall methodology and findings will all be covered in this post. Datawrangling requires that you first clean the data. Getting Started First, we need to import the necessary libraries.
7 types of statistical distributions with practical examples Statistical distributions help us understand a problem better by assigning a range of possible values to the variables, making them very useful in data science and machine learning. Here are 7 types of distributions with intuitive examples that often occur in real-life data.
For example, business analysts can use BI dashboards to conduct in-depth business analytics and visualize key performance metrics compiled from relevant datasets. They may also use tools such as Excel to sort, calculate and visualizedata.
There are several courses on Data Science for Non-Technical background aspirants ensuring that they can develop their skills and capabilities to become a Data Scientist. Let’s read the blog to know how can a non-technical person learn Data Science.
Data Science for CS Students can be an outstanding career choice that you can pursue as a Computer Science Engineer. However, how do you transition to a career in Data Science as a CS student? Let’s find out from the blog! Why Transition from Computer Science to Data Science?
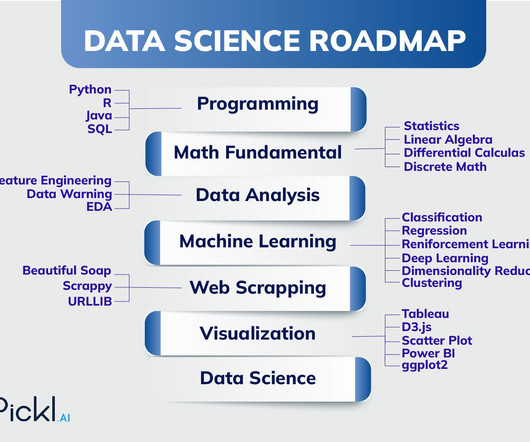
Key Takeaways: Data Science is a multidisciplinary field bridging statistics, mathematics, and computer science to extract insights from data. The roadmap to becoming a Data Scientist involves mastering programming, statistics, machine learning, datavisualization, and domain knowledge.
Let’s look at five benefits of an enterprise data catalog and how they make Alex’s workflow more efficient and her data-driven analysis more informed and relevant. A data catalog replaces tedious request and data-wrangling processes with a fast and seamless user experience to manage and access data products.
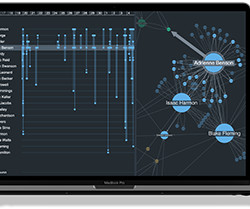
This blog post explores how graph visualization brings digital twins to life. Graph visualization SDKs would have been a huge asset to those projects. To prove this, I built my own digital twin using the KeyLines graph visualization toolkit. What is a digital twin? What comes to mind when you think of a digital twin?
Definition, Types & How to Create Ever felt overwhelmed by data but unsure how to translate it into actionable insights? This blog dives deep into the concept of MIS reports, explores different report formats, and equips you with the knowledge to create impactful reports in Excel. What is an MIS Report Meaning?
Packages like stats, car, and survival are commonly used for statistical modeling and analysis. · DataVisualization : R offers several libraries, including ggplot2, plotly, and lattice, that allow for the creation of high-quality visualizations.
A well-structured syllabus for Big Data encompasses various aspects, including foundational concepts, technologies, data processing techniques, and real-world applications. This blog aims to provide a comprehensive overview of a typical Big Data syllabus, covering essential topics that aspiring data professionals should master.
Here are some details about these packages: jupyterlab is for model building and data exploration. matplotlib is for datavisualization. missingno is for missing values visualization. In your new virtual environment, install the following packages (which include libraries and dependencies): pip3 install jupyterlab==3.4.3
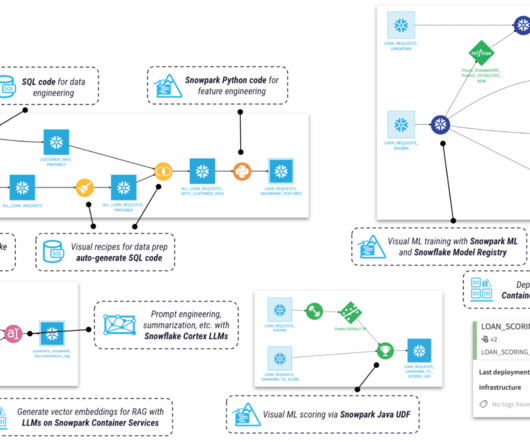
Snowflake excels in efficient data storage and governance, while Dataiku provides the tooling to operationalize advanced analytics and machine learning models. Together they create a powerful, flexible, and scalable foundation for modern data applications.
We organize all of the trending information in your field so you don't have to. Join 17,000+ users and stay up to date on the latest articles your peers are reading.
You know about us, now we want to get to know you!
Let's personalize your content
Let's get even more personalized
We recognize your account from another site in our network, please click 'Send Email' below to continue with verifying your account and setting a password.


Let's personalize your content