This site uses cookies to improve your experience. To help us insure we adhere to various privacy regulations, please select your country/region of residence. If you do not select a country, we will assume you are from the United States. Select your Cookie Settings or view our Privacy Policy and Terms of Use.
Cookie Settings
Cookies and similar technologies are used on this website for proper function of the website, for tracking performance analytics and for marketing purposes. We and some of our third-party providers may use cookie data for various purposes. Please review the cookie settings below and choose your preference.
Used for the proper function of the website
Used for monitoring website traffic and interactions
Cookie Settings
Cookies and similar technologies are used on this website for proper function of the website, for tracking performance analytics and for marketing purposes. We and some of our third-party providers may use cookie data for various purposes. Please review the cookie settings below and choose your preference.
Strictly Necessary: Used for the proper function of the website
Performance/Analytics: Used for monitoring website traffic and interactions
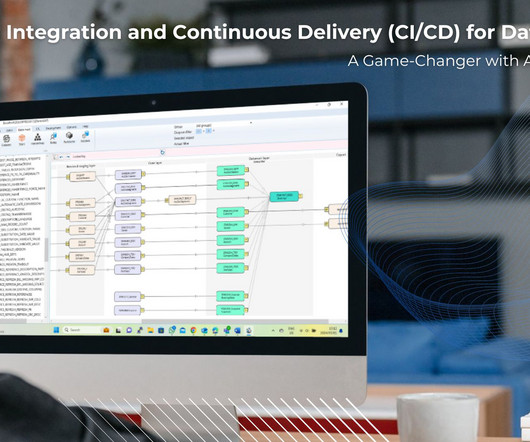
Enter AnalyticsCreator AnalyticsCreator, a powerful tool for data management, brings a new level of efficiency and reliability to the CI/CD process. It offers full BI-Stack Automation, from source to datawarehouse through to frontend. Data Lakes : It supports MS Azure Blob Storage.
When thinking about PowerBI , the platform’s visuals and report side immediately come to mind. While the front-end report visuals are important and the most visible to end users, a lot goes on behind the scenes that contribute heavily to the end product, including data modeling. What is Data Modeling?
Vor einen Jahrzehnt war es immer noch recht üblich, sich einfach ein BI Tool zu nehmen, sowas wie QlikView, Tableau oder PowerBI, mittlerweile gibt es ja noch einige mehr, und da direkt die Daten reinzuladen und dann halt loszulegen mit dem Aufbau der Reports. Ein DataWarehouse ist eine oder eine Menge von Datenbanken.
How to Optimize PowerBI and Snowflake for Advanced Analytics Spencer Baucke May 25, 2023 The world of business intelligence and data modernization has never been more competitive than it is today. Table of Contents Why Discuss Snowflake & PowerBI?
Es bietet vollständige Automatisierung des BI-Stacks und unterstützt ein breites Spektrum an DataWarehouses, analytischen Datenbanken und Frontends. Automatisierung: Erstellt SQL-Code, DACPAC-Dateien, SSIS-Pakete, Data Factory-ARM-Vorlagen und XMLA-Dateien. Data Lakes: Unterstützt MS Azure Blob Storage.
In a perfect scenario, everything a data analyst would need to answer business users’ questions would live in cleaned, curated, and modeled tables in a datawarehouse. The analyst could connect to the datawarehouse and start developing reports. M is the formula language behind the scenes of Power Query.
Consequently, the tools we employ to process and visualize this data play a critical role. Among these tools, KNIME and PowerBI have emerged as key players, catering to the demands of this evolving landscape. KNIME Analytics Platform is an open-source data analytics tool that enables users to manage, process, and analyze data.
Eine bessere Idee ist es daher, Event Logs nicht in einzelnen Process Mining Tools aufzubereiten, sondern zentral in einem dafür vorgesehenen DataWarehouse zu erstellen, zu katalogisieren und darüber auch die grundsätzliche Data Governance abzusichern. appeared first on Data Science Blog.
Process Mining wurde kürzlich in die Power Automate Plattform und in PowerBI integriert. Process Mining Tools, die Business Intelligence Software erweitern Und dann gibt es noch diejenigen Anbieter, die bestehende BI Tools mit Erweiterungen zum Process Mining Analysewerkzeug machen. nicht mehr weiterentwickelt wird.
These products are curated with key attributes such as business domain, access level, delivery methods, recommended usage and data contracts. It empowers users of data lakehouses and datawarehouses to package their data assets as data products, simplifying data sharing and access.
The modern data stack is a combination of various software tools used to collect, process, and store data on a well-integrated cloud-based data platform. It is known to have benefits in handling data due to its robustness, speed, and scalability. A typical modern data stack consists of the following: A datawarehouse.
To pursue a data science career, you need a deep understanding and expansive knowledge of machine learning and AI. Watsonx comprises of three powerful components: the watsonx.ai Together, watsonx offers organizations the ability to: Train, tune and deploy AI across your business with watsonx.ai
This led to the birth of separate systems for reporting: the enterprise datawarehouse. For the first time, the focus of a system became business questions, where data was denormalized. Business teams still had to request data. But at its core, it’s about making data discoverable, trustworthy, and shareable.
According to a report by Gartner, organizations that utilize BI tools can improve their operational efficiency and gain competitive advantages over rivals. Furthermore, a study indicated that 71% of organisations consider Data Analytics a critical factor for enhancing their business performance.
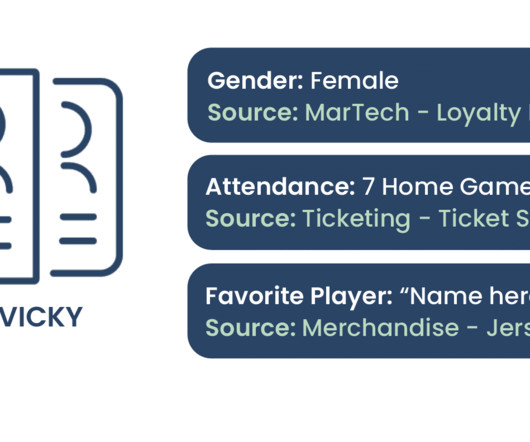
This blog was written by Sara Price and edited by Sunny Yan. In this blog, we’ll demonstrate how to utilize data to drive successful targeted and personalized campaigns for your fanbase to increase revenue, boost operational efficiency, and improve cross-departmental collaboration—all while providing an enriched fan experience.
Business Intelligence Analysts are the skilled artisans who transform this raw data into valuable insights, empowering organizations to make strategic decisions and stay ahead of the curve. Key Takeaways BI Analysts convert data into actionable insights for strategic business decisions. Ensuring data integrity and security.
Introduction Business Intelligence (BI) architecture is a crucial framework that organizations use to collect, integrate, analyze, and present business data. This architecture serves as a blueprint for BI initiatives, ensuring that data-driven decision-making is efficient and effective.
Analytics can be a powerful tool in this process, helping manufacturers to identify trends, optimize processes, and make informed decisions. In this blog, we’ll take a closer look into how analytics can be useful in manufacturing. What Analytic Tools Can Manufacturers Leverage to Make More Data-Driven Decisions?
Summary: This blog discusses best practices for designing effective fact tables in dimensional models. Additionally, it addresses common challenges and offers practical solutions to ensure that fact tables are structured for optimal data quality and analytical performance.
Summary: This blog delves into hierarchies in dimensional modelling, highlighting their significance in data organisation and analysis. Real-world examples illustrate their application, while tools and technologies facilitate effective hierarchical data management in various industries.
A well-structured syllabus for Big Data encompasses various aspects, including foundational concepts, technologies, data processing techniques, and real-world applications. This blog aims to provide a comprehensive overview of a typical Big Data syllabus, covering essential topics that aspiring data professionals should master.
This comprehensive blog outlines vital aspects of Data Analyst interviews, offering insights into technical, behavioural, and industry-specific questions. It covers essential topics such as SQL queries, data visualization, statistical analysis, machine learning concepts, and data manipulation techniques.
Here are steps you can follow to pursue a career as a BI Developer: Acquire a solid foundation in data and analytics: Start by building a strong understanding of data concepts, relational databases, SQL (Structured Query Language), and data modeling.
Data Engineering: Laying the Foundation for Data Success While Data Science deals with data analysis and insights, Data Engineering focuses on the design, construction, and maintenance of robust data pipelines and infrastructure. Excel, Tableau, PowerBI, SQL Server, MySQL, Google Analytics, etc.
Summary: This blog provides a comprehensive roadmap for aspiring Azure Data Scientists, outlining the essential skills, certifications, and steps to build a successful career in Data Science using Microsoft Azure. Platforms like GitHub, Kaggle, and Stack Overflow are valuable resources for learning and sharing knowledge.
Data engineering is all about collecting, organising, and moving data so businesses can make better decisions. Handling massive amounts of data would be a nightmare without the right tools. In this blog, well explore the best data engineering tools that make data work easier, faster, and more reliable.
We organize all of the trending information in your field so you don't have to. Join 17,000+ users and stay up to date on the latest articles your peers are reading.
You know about us, now we want to get to know you!
Let's personalize your content
Let's get even more personalized
We recognize your account from another site in our network, please click 'Send Email' below to continue with verifying your account and setting a password.


Let's personalize your content