This site uses cookies to improve your experience. To help us insure we adhere to various privacy regulations, please select your country/region of residence. If you do not select a country, we will assume you are from the United States. Select your Cookie Settings or view our Privacy Policy and Terms of Use.
Cookie Settings
Cookies and similar technologies are used on this website for proper function of the website, for tracking performance analytics and for marketing purposes. We and some of our third-party providers may use cookie data for various purposes. Please review the cookie settings below and choose your preference.
Used for the proper function of the website
Used for monitoring website traffic and interactions
Cookie Settings
Cookies and similar technologies are used on this website for proper function of the website, for tracking performance analytics and for marketing purposes. We and some of our third-party providers may use cookie data for various purposes. Please review the cookie settings below and choose your preference.
Strictly Necessary: Used for the proper function of the website
Performance/Analytics: Used for monitoring website traffic and interactions
PowerBI is a powerful data visualization tool that helps them turn raw data into meaningful insights and actionable decisions. In this blog, we will explore the role of data analysts and how they use PowerBI to extract insights from data and drive business success.
PowerBI Desktop is a wonderful business intelligence tool that has an expansive list of reporting capabilities, but there is one thing that you aren’t able to do with it – create a paginated report, which is a specific style of report that is designed to be exported or printed. What Is PowerBI Report Builder?
It offers full BI-Stack Automation, from source to data warehouse through to frontend. It also supports a wide range of data warehouses, analytical databases, data lakes, frontends, and pipelines/ETL. Frontends : AnalyticsCreator supports PowerBI, Qlik Sense, Tableau, PowerPivot (Excel). pipelines, Azure Data Bricks.
When thinking about PowerBI , the platform’s visuals and report side immediately come to mind. Data modeling in PowerBI has a major impact on the performance of reports and should be considered a substantial learning milestone for new PowerBI developers. Why Does Data Modeling Matter in PowerBI?
How to Optimize PowerBI and Snowflake for Advanced Analytics Spencer Baucke May 25, 2023 The world of business intelligence and data modernization has never been more competitive than it is today. Table of Contents Why Discuss Snowflake & PowerBI?
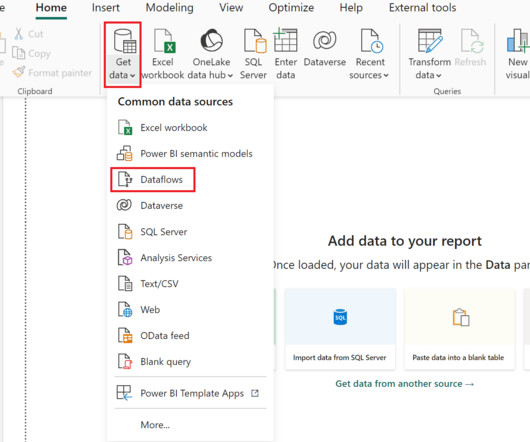
PowerBI Desktop enables the connection and retrieval of data from various sources, followed by data transformation using Power Query. To address this challenge, Microsoft introduced Dataflows within the PowerBI service. What are Dataflows in PowerBI?
They’ve tried to do this with the existing report created with PowerBI Desktop, and they can only see a small subset of the data from the table visualization when they export the report page as a PDF. In this blog post, we will introduce you to paginated reports in PowerBI and show you how to create one using PowerBI Report Builder.
The ability to create parameters for your data sources in PowerBI is not new; however, there are nuances to parameterizing your Snowflake connections that one should be aware of. In this blog, we’ll cover an example of how to build those parameters. In this blog, we’ll cover an example of how to build those parameters.
Summary : Microsoft Fabric is an end-to-end Data Analytics platform designed for integration, processing, and advanced insights, while PowerBI excels in creating interactive visualisations and reports. Key Takeaways Microsoft Fabric is a full-scale data platform, while PowerBI focuses on visualising insights.
In this blog, we will unfold the benefits of PowerBI and key PowerBI features , along with other details. What is PowerBI? PowerBI is loaded with features that help in making data-driven decisions. Here comes the role of PowerBI. billion by 2028.
We at phData have written extensively about creating centralized data products in PowerBI. In this blog, we will explain dataflows and their use cases and show an example of how to bring data from Snowflake AI Data Cloud into a dataflow. Second, it drives up consumption or compute resources in your database.
PowerBI Heatmap: Heatmap in PowerBI refers to the type of custom visualisation that businesses analysts utilise for showcasing the relationship between two variables on a map in different colour patches. It helps the user in visualising the patterns which are hidden and observe the changes across each axis.
As organizations embrace the power of self-service analytics and interactive dashboards, transitioning from SSRS to PowerBI becomes an enticing and oftentimes necessary decision. The PowerBI Service further enhances collaboration by enabling easy sharing and embedding reports in web pages and applications.
PowerBI provides the ability to connect various sources and systems, from Salesforce to SAP to Excel files and even Snowflake Data Cloud. Right now, there are nearly 180 native connectors available in PowerBI and an ODBC connector to work with sources that do not have their own dedicated connector. What is M Code?
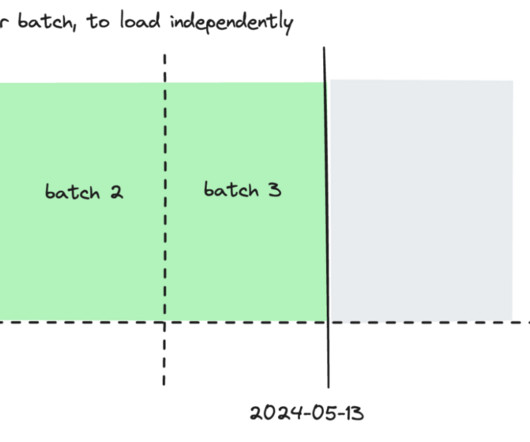
PowerBI is a user-friendly and powerful data visualization tool that enables individuals to easily create interactive reports and dashboards as well as centralized datasets. In this blog, we will explain the difference between Full Refresh & Incremental Refresh and how to implement Incremental refresh in PowerBI.
Using pre-production data during the development process of building a PowerBI dashboard is considered a best practice. In this blog, we will walk through how to use parameters in Power Query to help you more easily switch the data sources your PowerBI dashboard is using.
PowerBI Datamarts is one of the most exciting features that Microsoft has released for the Power Platform in recent years. If you need high-level information on what a PowerBI Datamart is and some example use cases, check out our other blog, What Are PowerBI Datamarts?
In addition to Business Intelligence (BI), Process Mining is no longer a new phenomenon, but almost all larger companies are conducting this data-driven process analysis in their organization. This aspect can be applied well to Process Mining, hand in hand with BI and AI.
For data scrapping a variety of sources, such as online databases, sensor data, or social media. By following the steps outlined in this blog, you can increase your chances of success. With the help of the model many insights can be drawn, and they can be visualized using software like PowerBI.
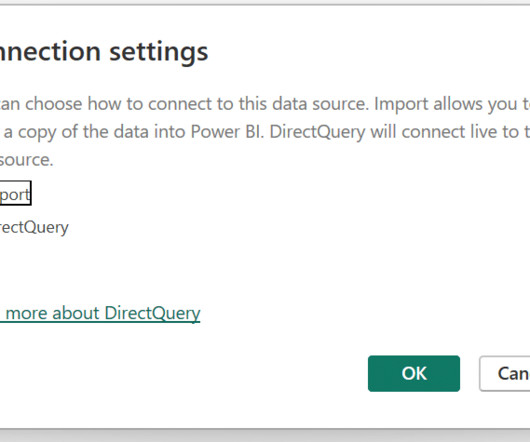
When connecting to data in PowerBI, you need to choose whether you want to use Import or Direct Query mode to connect to your data. Using the Import method, PowerBI captures and caches a snapshot of your data in PowerBI. What is PowerBI Direct Query? What is PowerBI Import?
In the digital age, the abundance of textual information available on the internet, particularly on platforms like Twitter, blogs, and e-commerce websites, has led to an exponential growth in unstructured data. These tools offer a wide range of functionalities to handle complex data preparation tasks efficiently.
In this blog, we will explore the arena of data science bootcamps and lay down a guide for you to choose the best data science bootcamp. Tools like Tableau, PowerBI, and Python libraries such as Matplotlib and Seaborn are commonly taught. These bootcamps are focused training and learning platforms for people.
This blog equips you with the top interview questions and answers, categorized by difficulty level. Whether you’re a beginner or a seasoned pro, you’ll find valuable insights on core concepts like normalization, transactions, and database joins. What are the different types of database queries? Don’t sweat it!
Additionally, data science requires experience in SQL database coding and an ability to work with unstructured data of various types, such as video, audio, pictures and text. To pursue a data science career, you need a deep understanding and expansive knowledge of machine learning and AI.
In the 1970s, data was confined to mainframes and primitive databases. The 1980s ushered in the antithesis of this version of computing — personal computing and distributed database management — but also introduced duplicated data and enterprise data silos. Subscribe to Alation's Blog. Business teams still had to request data.
According to a report by Gartner, organizations that utilize BI tools can improve their operational efficiency and gain competitive advantages over rivals. This blog will explore what Business Intelligence tools are, their functionalities, real-world applications, and address common questions surrounding them.
In this post, we describe how CBRE partnered with AWS Prototyping to develop a custom query environment allowing natural language query (NLQ) prompts by using Amazon Bedrock, AWS Lambda , Amazon Relational Database Service (Amazon RDS), and Amazon OpenSearch Service. Embeddings were generated using Amazon Titan.
Advancements in data processing, storage, and analysis technologies power this transformation. This blog aims to highlight the synergy between Data Science and the cloud, showcase its indispensable role in modern analytics, and outline strategies for leveraging this powerful combination effectively.
This blog will comprehensively explore the world of BI, dissecting what it is, the multifaceted responsibilities of a BI Analyst, and how to embark on this rewarding career path. Key Takeaways BI Analysts convert data into actionable insights for strategic business decisions.
Whether you’re a seasoned tech professional looking to switch lanes, a fresh graduate planning your career trajectory, or simply someone with a keen interest in the field, this blog post will walk you through the exciting journey towards becoming a data scientist. It’s time to turn your question into a quest.
Using tools like PowerBI, Tableau, and Grafana, organisations can analyse real-time IoT data, optimise operations, and enhance decision-making while addressing security, scalability, and visualisation challenges. This blog explores IoT data visualisation, its significance, techniques, tools, and applications.
Here are steps you can follow to pursue a career as a BI Developer: Acquire a solid foundation in data and analytics: Start by building a strong understanding of data concepts, relational databases, SQL (Structured Query Language), and data modeling.
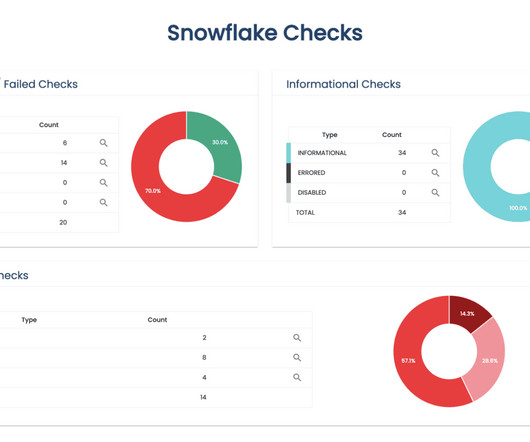
In this blog, you’ll learn more about phData’s ASMR tool and its capabilities. PowerBI Report Overview Page These generated insights aim to help administrators manage the environment more proactively, and provide users with visibility into their assets. Let’s dive in!
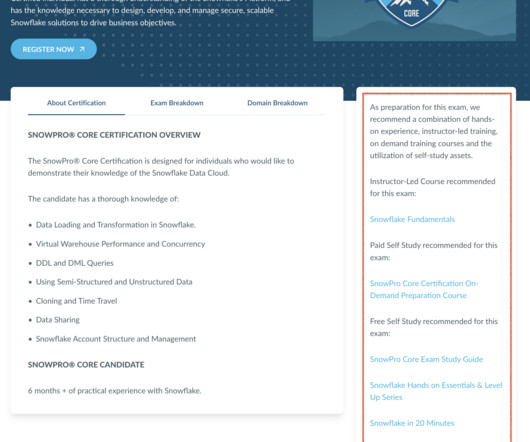
In this blog, I’ll guide you towards success in your Snowflake learning journey. The SnowPro Advanced Administrator Certification targets Snowflake Administrators, Snowflake Data Cloud Administrators, Database Administrators, Cloud Infrastructure Administrators, and Cloud Data Administrators.
In this blog, we’ll explore what bioinformatics is, how to become a Bioinformatics Scientist, the tools and techniques used, the various applications, the challenges, and the future directions of this exciting field. PowerBIPowerBI is a business analytics tool that allows researchers to create interactive dashboards and reports.
Let’s read the blog to find out! Consequently, if your results, scores, etc are stored in an SQL Database, Tableau can be able to quickly visualise easily your model metrics. With SQL queries Tableau helps in integrating with them effectively. But What is Tableau for Data Science and what are its advantages and disadvantages?
Introduction Business Intelligence (BI) architecture is a crucial framework that organizations use to collect, integrate, analyze, and present business data. This architecture serves as a blueprint for BI initiatives, ensuring that data-driven decision-making is efficient and effective. databases), semi-structured (e.g.,
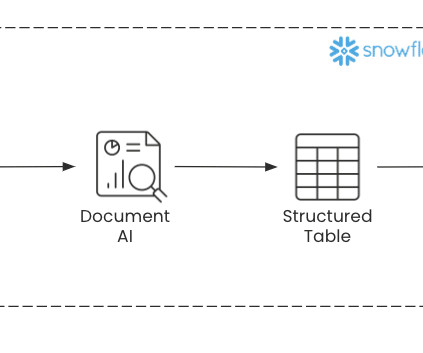
With Document AI from the Snowflake Data Cloud , organizations can utilize the power of LLMs to automate the process of converting unstructured documents into organized tables with ease! In this blog, we’ll cover what the Document AI tool is, what use cases it solves, and how to integrate it with document processing pipelines.
They create data pipelines, ETL processes, and databases to facilitate smooth data flow and storage. Their primary responsibilities include: Data Collection and Preparation Data Scientists start by gathering relevant data from various sources, including databases, APIs, and online platforms. ETL Tools: Apache NiFi, Talend, etc.
This blog was originally written by Erik Hyrkas and updated for 2024 by Justin Delisi This isn’t meant to be a technical how-to guide — most of those details are readily available via a quick Google search — but rather an opinionated review of key processes and potential approaches. One day is usually adequate for development use.
Since data manipulation in data science has become integral for organisations, in this blog, we have focused on discussing its key features and data manipulation examples that will help you understand the significance of this technique. On the other hand, data modification refers to altering the structure or schema of a database.
Summary: This blog provides a comprehensive overview of data collection, covering its definition, importance, methods, and types of data. This blog aims to provide a comprehensive overview of data collection, including its definition, importance, methods, types of data, tools, and techniques for effective data collection.
In this blog, I’ll share my experience attending, highlight some exciting awards, and unpack all the exciting updates from the event. BI Tool Integration: A new dbt Semantic Layer connection to PowerBI is coming soon! which is already in beta at the moment of this blog. Source: [link] dbt Core v1.9 Before 1.9,
This blog aims to provide a comprehensive overview of a typical Big Data syllabus, covering essential topics that aspiring data professionals should master. Understanding the differences between SQL and NoSQL databases is crucial for students. Visualisation Tools Familiarity with tools such as Tableau, PowerBI, and D3.js
We organize all of the trending information in your field so you don't have to. Join 17,000+ users and stay up to date on the latest articles your peers are reading.
You know about us, now we want to get to know you!
Let's personalize your content
Let's get even more personalized
We recognize your account from another site in our network, please click 'Send Email' below to continue with verifying your account and setting a password.


Let's personalize your content