This site uses cookies to improve your experience. To help us insure we adhere to various privacy regulations, please select your country/region of residence. If you do not select a country, we will assume you are from the United States. Select your Cookie Settings or view our Privacy Policy and Terms of Use.
Cookie Settings
Cookies and similar technologies are used on this website for proper function of the website, for tracking performance analytics and for marketing purposes. We and some of our third-party providers may use cookie data for various purposes. Please review the cookie settings below and choose your preference.
Used for the proper function of the website
Used for monitoring website traffic and interactions
Cookie Settings
Cookies and similar technologies are used on this website for proper function of the website, for tracking performance analytics and for marketing purposes. We and some of our third-party providers may use cookie data for various purposes. Please review the cookie settings below and choose your preference.
Strictly Necessary: Used for the proper function of the website
Performance/Analytics: Used for monitoring website traffic and interactions
Making visualizations is one of the finest ways for data scientists to explain dataanalysis to people outside the business. Exploratorydataanalysis can help you comprehend your data better, which can aid in future data preprocessing. ExploratoryDataAnalysis What is EDA?
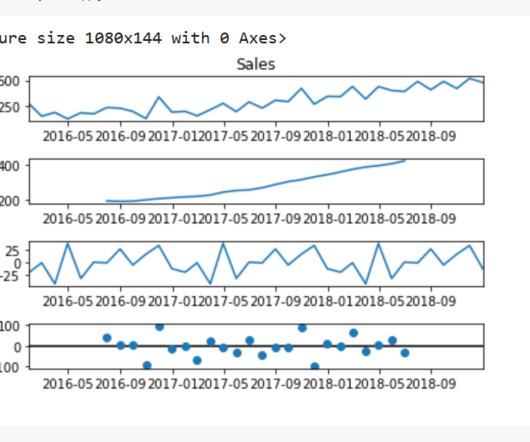
In this practical Kaggle notebook, I went through the basic techniques to work with time-series data, starting from data manipulation, analysis, and visualization to understand your data and prepare it for and then using statistical, machine, and deeplearning techniques for forecasting and classification.
1, Data is the new oil, but labeled data might be closer to it Even though we have been in the 3rd AI boom and machine learning is showing concrete effectiveness at a commercial level, after the first two AI booms we are facing a problem: lack of labeled data or data themselves.
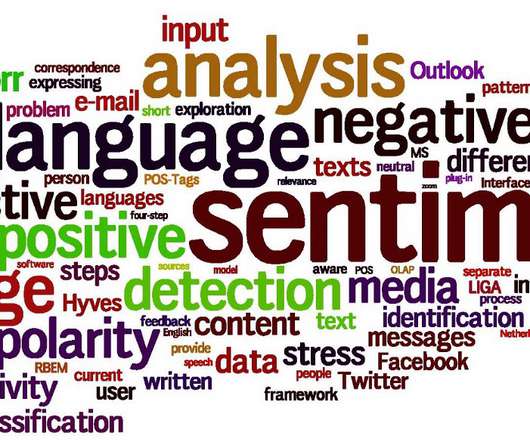
Leverage the Watson NLP library to build the best classification models by combining the power of classic ML, DeepLearning, and Transformed based models. link] Text classification is one of the most used NLP tasks for several use cases like email spam filtering, tagging, and classifying content, blogs, metadata, etc.
The scope of LLMOps within machine learning projects can vary widely, tailored to the specific needs of each project. Some projects may necessitate a comprehensive LLMOps approach, spanning tasks from data preparation to pipeline production.
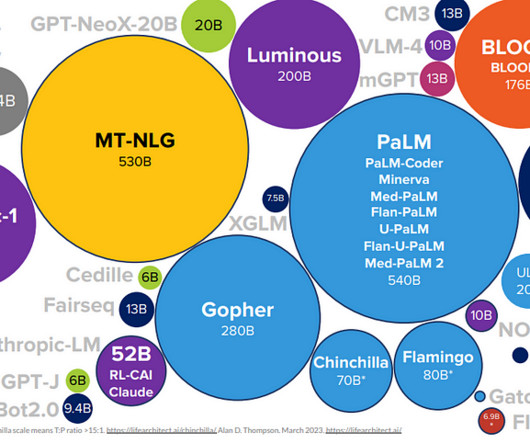
It wasn’t until the development of deeplearning algorithms in the 2000s and 2010s that LLMs truly began to take shape. Deeplearning algorithms are designed to mimic the structure and function of the human brain, allowing them to process vast amounts of data and learn from that data over time.
Model architectures : All four winners created ensembles of deeplearning models and relied on some combination of UNet, ConvNext, and SWIN architectures. In the modeling phase, XGBoost predictions serve as features for subsequent deeplearning models. Test-time augmentations were used with mixed results.
Every day, new research and new information flood our technical newsletter subscriptions and our favorite technical blogs. Task Orientation How were we doing machine learning almost a year ago? They support Transfer Learning. What is Transfer Learning? I am personally liking this scenario. In fact, even today.
Applying XGBoost on a Problem Statement Applying XGBoost to Our Dataset Summary Citation Information Scaling Kaggle Competitions Using XGBoost: Part 4 Over the last few blog posts of this series, we have been steadily building up toward our grand finish: deciphering the mystery behind eXtreme Gradient Boosting (XGBoost) itself.
Comet is an MLOps platform that offers a suite of tools for machine-learning experimentation and dataanalysis. It is designed to make it easy to track and monitor experiments and conduct exploratorydataanalysis (EDA) using popular Python visualization frameworks.
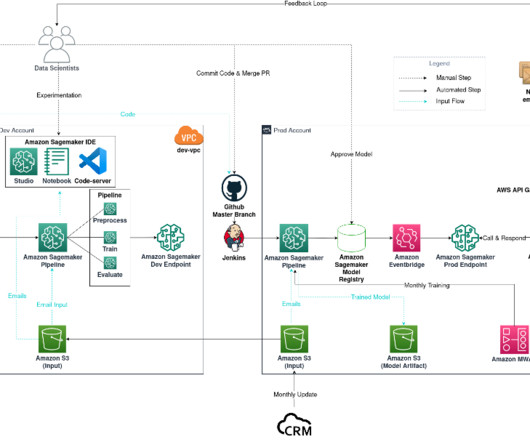
Email classification project diagram The workflow consists of the following components: Model experimentation – Data scientists use Amazon SageMaker Studio to carry out the first steps in the data science lifecycle: exploratorydataanalysis (EDA), data cleaning and preparation, and building prototype models.
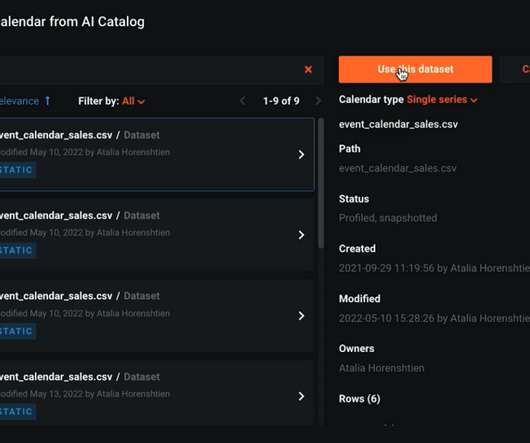
If your dataset is not in time order (time consistency is required for accurate Time Series projects), DataRobot can fix those gaps using the DataRobot Data Prep tool , a no-code tool that will get your data ready for Time Series forecasting. Prepare your data for Time Series Forecasting. Perform exploratorydataanalysis.
Comet Comet is a platform for experimentation that enables you to monitor your machine-learning experiments. Comet has another noteworthy feature: it allows us to conduct exploratorydataanalysis. You can learn more about Comet here. train.head() We also perform EDA on the test dataset.
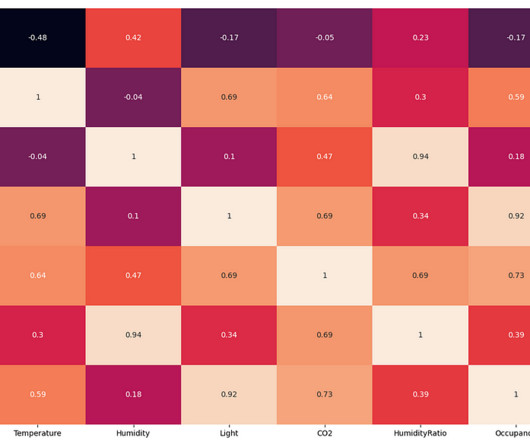
The exploratorydataanalysis found that the change in room temperature, CO levels, and light intensity can be used to predict the occupancy of the room in place of humidity and humidity ratio. We will also be looking at the correlation between the variables. We pay our contributors, and we don't sell ads.
There is a position called Data Analyst whose work is to analyze the historical data, and from that, they will derive some KPI s (Key Performance Indicators) for making any further calls. For DataAnalysis you can focus on such topics as Feature Engineering , Data Wrangling , and EDA which is also known as ExploratoryDataAnalysis.
I will start by looking at the data distribution, followed by the relationship between the target variable and independent variables. Editor's Note: Heartbeat is a contributor-driven online publication and community dedicated to providing premier educational resources for data science, machine learning, and deeplearning practitioners.
Data Science for CS Students can be an outstanding career choice that you can pursue as a Computer Science Engineer. However, how do you transition to a career in Data Science as a CS student? Let’s find out from the blog! Why Transition from Computer Science to Data Science?
It entails developing computer programs that can improve themselves on their own based on expertise or data. There are two types of Machine Learning techniques, including supervised and unsupervised learning. The following blog will focus on Unsupervised Machine Learning Models focusing on the algorithms and types with examples.
In this tutorial, you will learn the underlying math behind one of the prerequisites of XGBoost. Jump Right To The Downloads Section Scaling Kaggle Competitions Using XGBoost: Part 2 In the previous blog post of this series, we briefly covered concepts like decision trees and gradient boosting, before touching up on the concept of XGBoost.
This comprehensive blog outlines vital aspects of Data Analyst interviews, offering insights into technical, behavioural, and industry-specific questions. It covers essential topics such as SQL queries, data visualization, statistical analysis, machine learning concepts, and data manipulation techniques.
Summary: This blog provides a comprehensive roadmap for aspiring Azure Data Scientists, outlining the essential skills, certifications, and steps to build a successful career in Data Science using Microsoft Azure. Azure’s GPU and TPU instances further accelerate the training of deeplearning models.
Editor’s Note: Heartbeat is a contributor-driven online publication and community dedicated to providing premier educational resources for data science, machine learning, and deeplearning practitioners. We’re committed to supporting and inspiring developers and engineers from all walks of life.
Both the missing sales data and the limited length of historical sales data pose significant challenges in terms of model accuracy for long-term sales prediction into 2026. However, the maximum length of historical sales data (maximum length of 140 months) still posed significant challenges in terms of model accuracy.
About Comet Comet is an experimentation tool that helps you keep track of your machine-learning studies. Another significant aspect of Comet is that it enables us to carry out exploratorydataanalysis. You can learn more about Comet here. We pay our contributors, and we don’t sell ads.
Their primary responsibilities include: Data Collection and Preparation Data Scientists start by gathering relevant data from various sources, including databases, APIs, and online platforms. They clean and preprocess the data to remove inconsistencies and ensure its quality. Big Data Technologies: Hadoop, Spark, etc.
It is therefore important to carefully plan and execute data preparation tasks to ensure the best possible performance of the machine learning model. Batch size and learning rate are two important hyperparameters that can significantly affect the training of deeplearning models, including LLMs.
In a typical MLOps project, similar scheduling is essential to handle new data and track model performance continuously. Load and Explore Data We load the Telco Customer Churn dataset and perform exploratorydataanalysis (EDA). Experiment Tracking in CometML (Image by the Author) 2.
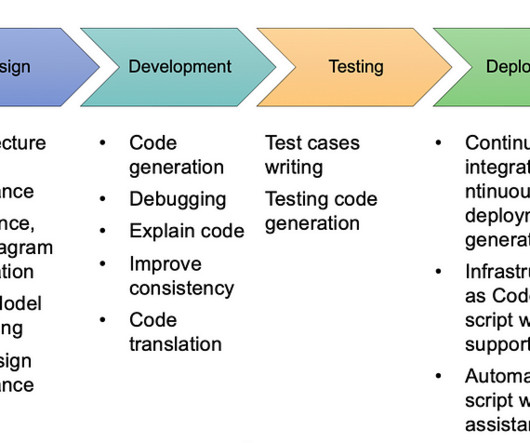
Blog - Everest Group Requirements gathering: ChatGPT can significantly simplify the requirements gathering phase by building quick prototypes of complex applications. New developers should learn basic concepts (e.g. Submission Suggestions Generative AI in Software Development was originally published in MLearning.ai
One of the biggest challenges that students face after clearing college is to find the right learning platform. So, if you are eyeing your career in the data domain, this blog will take you through some of the best colleges for Data Science in India. Hence it has emerged as a popular career opportunity.
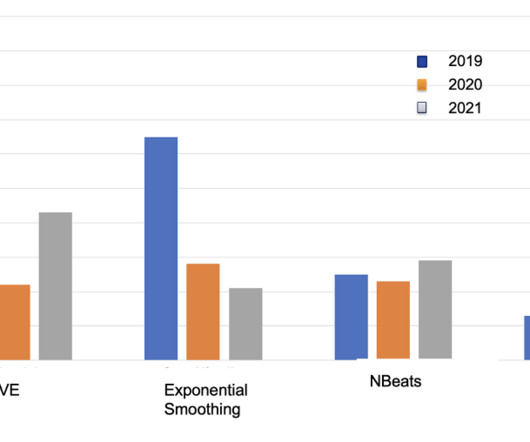
This blog will explore the intricacies of AI Time Series Forecasting, its challenges, popular models, implementation steps, applications, tools, and future trends. Making Data Stationary: Many forecasting models assume stationarity. In 2024, the global Time Series Forecasting market was valued at approximately USD 214.6
In this article, let’s dive deep into the Natural Language Toolkit (NLTK) data processing concepts for NLP data. Before building our model, we will also see how we can visualize this data with Kangas as part of exploratorydataanalysis (EDA). We pay our contributors, and we don’t sell ads.
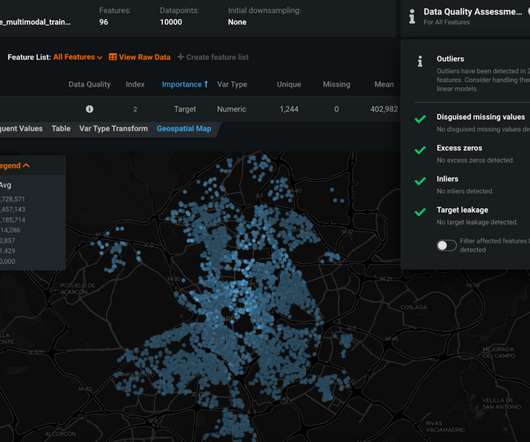
You can understand the data and model’s behavior at any time. Once you use a training dataset, and after the ExploratoryDataAnalysis, DataRobot flags any data quality issues and, if significant issues are spotlighted, will automatically handle them in the modeling stage. Rapid Modeling with DataRobot AutoML.
It is important to experience such problems as they reflect a lot of the issues that a data practitioner is bound to experience in a business environment. We first get a snapshot of our data by visually inspecting it and also performing minimal ExploratoryDataAnalysis just to make this article easier to follow through.
I have 2 years of experience in dataanalysis and over 3 years of experience in developing deeplearning architectures. During an actual dataanalysis project that I was involved in, I had the opportunity to extract insights from a large-scale text dataset similar to what we used for this project.
We organize all of the trending information in your field so you don't have to. Join 17,000+ users and stay up to date on the latest articles your peers are reading.
You know about us, now we want to get to know you!
Let's personalize your content
Let's get even more personalized
We recognize your account from another site in our network, please click 'Send Email' below to continue with verifying your account and setting a password.


Let's personalize your content