This site uses cookies to improve your experience. To help us insure we adhere to various privacy regulations, please select your country/region of residence. If you do not select a country, we will assume you are from the United States. Select your Cookie Settings or view our Privacy Policy and Terms of Use.
Cookie Settings
Cookies and similar technologies are used on this website for proper function of the website, for tracking performance analytics and for marketing purposes. We and some of our third-party providers may use cookie data for various purposes. Please review the cookie settings below and choose your preference.
Used for the proper function of the website
Used for monitoring website traffic and interactions
Cookie Settings
Cookies and similar technologies are used on this website for proper function of the website, for tracking performance analytics and for marketing purposes. We and some of our third-party providers may use cookie data for various purposes. Please review the cookie settings below and choose your preference.
Strictly Necessary: Used for the proper function of the website
Performance/Analytics: Used for monitoring website traffic and interactions
It also supports a wide range of data warehouses, analytical databases, data lakes, frontends, and pipelines/ETL. Frontends : AnalyticsCreator supports PowerBI, Qlik Sense, Tableau, PowerPivot (Excel). Pipelines/ETL : It supports SQL Server Integration Packages (SSIS), Azure Data Factory 2.0 pipelines, Azure Data Bricks.
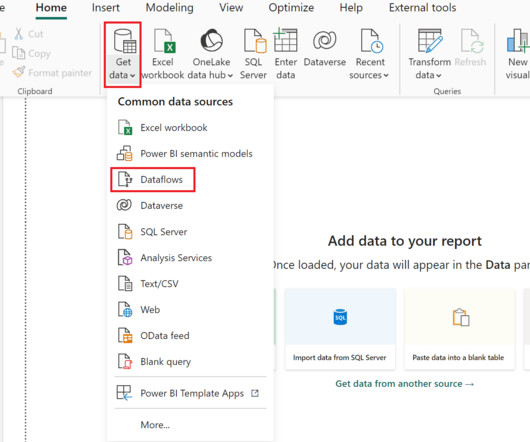
PowerBI Desktop enables the connection and retrieval of data from various sources, followed by data transformation using Power Query. To address this challenge, Microsoft introduced Dataflows within the PowerBI service. What are Dataflows in PowerBI?
Summary : Microsoft Fabric is an end-to-end Data Analytics platform designed for integration, processing, and advanced insights, while PowerBI excels in creating interactive visualisations and reports. Key Takeaways Microsoft Fabric is a full-scale data platform, while PowerBI focuses on visualising insights.
Frontends : Kompatibel mit Tools wie PowerBI, Qlik Sense und Tableau. Pipelines/ETL : Unterstützt Technologien wie SQL Server Integration Services und Azure Data Factory. Vielfältige Unterstützung: Kompatibel mit verschiedenen Datenbankmanagementsystemen wie MS SQL Server und Azure Synapse Analytics.
Summary: PowerBI is a business intelligence tool that transforms raw data into actionable insights. PowerBI enhances decision-making by providing interactive dashboards and reports that are accessible to both technical and non-technical users. What Is PowerBI?
We at phData have written extensively about creating centralized data products in PowerBI. In this blog, we will explain dataflows and their use cases and show an example of how to bring data from Snowflake AI Data Cloud into a dataflow. What are Dataflows, and Why are They So Great?
Among these tools, KNIME and PowerBI have emerged as key players, catering to the demands of this evolving landscape. Microsoft PowerBI has established itself as a premier data visualization product used to turn unrelated data sources into coherent, visually immersive, and interactive insights.
PowerBI Datamarts is one of the most exciting features that Microsoft has released for the Power Platform in recent years. If you need high-level information on what a PowerBI Datamart is and some example use cases, check out our other blog, What Are PowerBI Datamarts?
This blog post explores effective strategies for gathering requirements in your data project. ETL tools : Map how data will be extracted, transformed, and loaded. Actionable steps: Create mockups : Use tools like Figma or PowerBI to prototype dashboards and reports. Key questions to ask: What data sources are required?
In the digital age, the abundance of textual information available on the internet, particularly on platforms like Twitter, blogs, and e-commerce websites, has led to an exponential growth in unstructured data. These tools offer a wide range of functionalities to handle complex data preparation tasks efficiently.
According to a report by Gartner, organizations that utilize BI tools can improve their operational efficiency and gain competitive advantages over rivals. This blog will explore what Business Intelligence tools are, their functionalities, real-world applications, and address common questions surrounding them.
In this blog, we will explore the arena of data science bootcamps and lay down a guide for you to choose the best data science bootcamp. Tools like Tableau, PowerBI, and Python libraries such as Matplotlib and Seaborn are commonly taught. These bootcamps are focused training and learning platforms for people.
Reverse ETL tools. Business intelligence (BI) platforms. The modern data stack is also the consequence of a shift in analysis workflow, fromextract, transform, load (ETL) to extract, load, transform (ELT). A Note on the Shift from ETL to ELT. In the past, data movement was defined by ETL: extract, transform, and load.
This blog will comprehensively explore the world of BI, dissecting what it is, the multifaceted responsibilities of a BI Analyst, and how to embark on this rewarding career path. Key Takeaways BI Analysts convert data into actionable insights for strategic business decisions.
Introduction Business Intelligence (BI) architecture is a crucial framework that organizations use to collect, integrate, analyze, and present business data. This architecture serves as a blueprint for BI initiatives, ensuring that data-driven decision-making is efficient and effective.
Here are steps you can follow to pursue a career as a BI Developer: Acquire a solid foundation in data and analytics: Start by building a strong understanding of data concepts, relational databases, SQL (Structured Query Language), and data modeling.
They create data pipelines, ETL processes, and databases to facilitate smooth data flow and storage. Read Blog Data Engineering Interview Questions and Answers Role of Data Engineers Data Engineers are the architects of data infrastructure. ETL Tools: Apache NiFi, Talend, etc. Read more to know.
Summary: This blog delves into hierarchies in dimensional modelling, highlighting their significance in data organisation and analysis. This blog will explore the significance of hierarchies in dimensional modelling, their design, implementation, and best practices, along with real-world examples and tools used in the process.
This comprehensive blog outlines vital aspects of Data Analyst interviews, offering insights into technical, behavioural, and industry-specific questions. Data Warehousing and ETL Processes What is a data warehouse, and why is it important? Explain the Extract, Transform, Load (ETL) process. Access to IBM Cloud Lite account.
Summary: This blog discusses best practices for designing effective fact tables in dimensional models. This blog will delve into best practices for identifying, designing, and leveraging business metrics in dimensional models, drawing from real-world examples and highlighting the tools and technologies that support this process.
This blog aims to provide a comprehensive overview of a typical Big Data syllabus, covering essential topics that aspiring data professionals should master. Understanding ETL (Extract, Transform, Load) processes is vital for students. Visualisation Tools Familiarity with tools such as Tableau, PowerBI, and D3.js
Read Blogs: Crucial Statistics Interview Questions for Data Science Success. 2024’s top PowerBI interview questions simplified. Then, I would use tools like `mongoimport` and `mongoexport` or custom ETL scripts to transfer the data. Expect easy, complex, and scenario-based questions, each with detailed explanations.
This blog explores how different topics gained momentum, which areas declined, and what this tells us about the future of datascience. 20222024: As AI models required larger and cleaner datasets, interest in data pipelines, ETL frameworks, and real-time data processing surged.
In this blog, well explore the best data engineering tools that make data work easier, faster, and more reliable. PowerBIPowerBI is another widely used business intelligence tool that helps transform raw data into meaningful insights through interactive dashboards and reports.
We organize all of the trending information in your field so you don't have to. Join 17,000+ users and stay up to date on the latest articles your peers are reading.
You know about us, now we want to get to know you!
Let's personalize your content
Let's get even more personalized
We recognize your account from another site in our network, please click 'Send Email' below to continue with verifying your account and setting a password.


Let's personalize your content