This site uses cookies to improve your experience. To help us insure we adhere to various privacy regulations, please select your country/region of residence. If you do not select a country, we will assume you are from the United States. Select your Cookie Settings or view our Privacy Policy and Terms of Use.
Cookie Settings
Cookies and similar technologies are used on this website for proper function of the website, for tracking performance analytics and for marketing purposes. We and some of our third-party providers may use cookie data for various purposes. Please review the cookie settings below and choose your preference.
Used for the proper function of the website
Used for monitoring website traffic and interactions
Cookie Settings
Cookies and similar technologies are used on this website for proper function of the website, for tracking performance analytics and for marketing purposes. We and some of our third-party providers may use cookie data for various purposes. Please review the cookie settings below and choose your preference.
Strictly Necessary: Used for the proper function of the website
Performance/Analytics: Used for monitoring website traffic and interactions
When thinking about PowerBI , the platform’s visuals and report side immediately come to mind. Data modeling in PowerBI has a major impact on the performance of reports and should be considered a substantial learning milestone for new PowerBI developers. Why Does Data Modeling Matter in PowerBI?
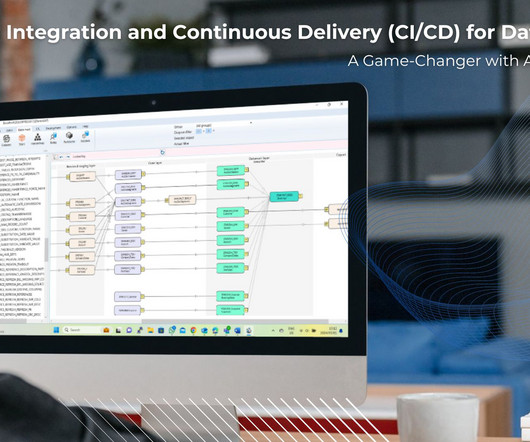
Frontends : AnalyticsCreator supports PowerBI, Qlik Sense, Tableau, PowerPivot (Excel). The post CI/CD for Data Pipelines: A Game-Changer with AnalyticsCreator appeared first on Data Science Blog. Data Lakes : It supports MS Azure Blob Storage. pipelines, Azure Data Bricks.
How to Optimize PowerBI and Snowflake for Advanced Analytics Spencer Baucke May 25, 2023 The world of business intelligence and data modernization has never been more competitive than it is today. Table of Contents Why Discuss Snowflake & PowerBI?
Vor einen Jahrzehnt war es immer noch recht üblich, sich einfach ein BI Tool zu nehmen, sowas wie QlikView, Tableau oder PowerBI, mittlerweile gibt es ja noch einige mehr, und da direkt die Daten reinzuladen und dann halt loszulegen mit dem Aufbau der Reports. appeared first on Data Science Blog. Für Data Science ja sowieso.
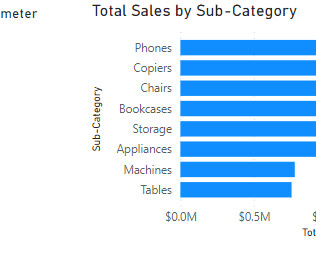
In this blog, I will walk you through what Field Parameters are and why they are important, and finally, I’ll show you how to use them with an example. By the end of this blog, you should have a decent working knowledge of how Field Parameters can make your life as a PowerBI developer much easier. Contact phData Today!
Frontends : Kompatibel mit Tools wie PowerBI, Qlik Sense und Tableau. Dies führt zu schnelleren und verlässlicheren Updates und stellt eine wesentliche Verbesserung im Bereich der Datenwi The post CI/CD für Datenpipelines – Ein Game-Changer mit AnalyticsCreator appeared first on Data Science Blog.
On the same day as Qlik’s roadmap keynote and PowerBI’s Summit in Ireland, Tableau decides to rain on both of those parades. Tableau stole the thunder yesterday with. by Jen Underwood. Read More.
Tableau is a data visualisation software helping you to generate graphics-rich reporting and analysing enormous volumes of data. With the help of Tableau, organisations have been able to mine and gather actionable insights from granular sources of data. But What is Tableau for Data Science and what are its advantages and disadvantages?
To get participants started, we published a blog post outlining some commonly used open Earth observation datasets. QGIS, Microsoft's PowerBI, Tableau, and Jupyter notebooks also facilitated many interesting visualizations, particularly for solvers with less programming experience.
In the digital age, the abundance of textual information available on the internet, particularly on platforms like Twitter, blogs, and e-commerce websites, has led to an exponential growth in unstructured data. These tools offer a wide range of functionalities to handle complex data preparation tasks efficiently.
It is therefore hardly surprising that some process mining tools are actually just a plugin for PowerBI, Tableau or Qlik. The post Object-centric Process Mining on Data Mesh Architectures appeared first on Data Science Blog. Nevertheless, process mining can be considered a sub-discipline of business intelligence.
This blog explores top certifications, factors to consider when choosing one, and future trends, helping aspiring and experienced analysts navigate their professional growth effectively. They use data visualisation tools like Tableau and PowerBI to create compelling reports.
This blog aims to equip you with the core questions often asked during interviews. Data visualization tools like Tableau and PowerBI can be applied to inform decisions. In modern organizations, the significance of the Business Analyst role lies in their ability to interpret data. Who Is a Business Analyst?
Oktober 2014 ↑ The post Big Data – Das Versprechen wurde eingelöst appeared first on Data Science Blog. Cloud Computing , erst mit den Infrastructure as a Service (IaaS) Angeboten von Amazon, Microsoft und Google, wurde zum Enabler für schnelle, flexible Big Data Architekturen. Retrieved August 1, 2020. 2022 ↑ developer.nvidia.com , 1.
Using tools like PowerBI, Tableau, and Grafana, organisations can analyse real-time IoT data, optimise operations, and enhance decision-making while addressing security, scalability, and visualisation challenges. This blog explores IoT data visualisation, its significance, techniques, tools, and applications.
Whether you’re a seasoned tech professional looking to switch lanes, a fresh graduate planning your career trajectory, or simply someone with a keen interest in the field, this blog post will walk you through the exciting journey towards becoming a data scientist. It’s time to turn your question into a quest.
According to a report by Gartner, organizations that utilize BI tools can improve their operational efficiency and gain competitive advantages over rivals. This blog will explore what Business Intelligence tools are, their functionalities, real-world applications, and address common questions surrounding them.
This blog will comprehensively explore the world of BI, dissecting what it is, the multifaceted responsibilities of a BI Analyst, and how to embark on this rewarding career path. Key Takeaways BI Analysts convert data into actionable insights for strategic business decisions.
Advancements in data processing, storage, and analysis technologies power this transformation. This blog aims to highlight the synergy between Data Science and the cloud, showcase its indispensable role in modern analytics, and outline strategies for leveraging this powerful combination effectively.
In this blog, we will explore the arena of data science bootcamps and lay down a guide for you to choose the best data science bootcamp. Tools like Tableau, PowerBI, and Python libraries such as Matplotlib and Seaborn are commonly taught. These bootcamps are focused training and learning platforms for people.
js and Tableau Data science, data analytics and IBM Practicing data science isn’t without its challenges. To pursue a data science career, you need a deep understanding and expansive knowledge of machine learning and AI. Together, watsonx offers organizations the ability to: Train, tune and deploy AI across your business with watsonx.ai
This blog explores this dynamic role’s updated responsibilities, required skills, and growth opportunities. Expertise in tools like PowerBI, SQL, and Python is crucial. Certifications like Certified Business Analysis Professional (CBAP), Six Sigma, or Tableau Desktop Specialist can provide a competitive edge.
In this blog post, we’ll explore some of these advanced techniques and how they can be used to enhance analytical capabilities. Tools like Tableau, PowerBI, and D3.js PowerBI A powerful and versatile tool from Microsoft, PowerBI integrates seamlessly with other Microsoft products like Excel.
Although it became easier for BI and analytics teams to create custom reports and dashboards in tools such as Tableau, Looker, and PowerBI those tools still isolated the user from data. Subscribe to Alation's Blog. The post Self-Service BI vs Traditional BI: What’s Next? appeared first on Alation.
In this blog, you’ll learn more about phData’s ASMR tool and its capabilities. PowerBI Report Overview Page These generated insights aim to help administrators manage the environment more proactively, and provide users with visibility into their assets. Let’s dive in!
The blog will answer your question. Along with Tableau, the curriculum also provides supervised and unsupervised learning opportunities. Significantly, the course curriculum includes topics like Tableau, Machine Learning , Python and Python Libraries, NLP, PowerBI, Data Visualisation and others.
Users like to see the data directly and manipulate the data using published programs like Tableau, PowerBI, or whatever URL site you select (it could be a google sheet or a github repository transformed into a github page). WARNING that some code snippets MIGHT not work ? It was very easy to setup!
In this blog, we’ll explore what bioinformatics is, how to become a Bioinformatics Scientist, the tools and techniques used, the various applications, the challenges, and the future directions of this exciting field. PowerBIPowerBI is a business analytics tool that allows researchers to create interactive dashboards and reports.
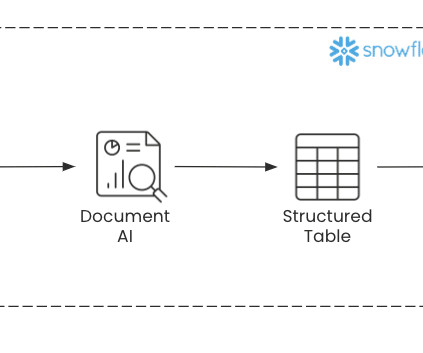
With Document AI from the Snowflake Data Cloud , organizations can utilize the power of LLMs to automate the process of converting unstructured documents into organized tables with ease! In this blog, we’ll cover what the Document AI tool is, what use cases it solves, and how to integrate it with document processing pipelines.
Something quite common in the routine of those who manage applications on Servers, such as the Alteryx Server , Tableau Server , PowerBI Server , or even Snowflake Data Cloud , is solving problems that users occasionally face or at least carrying out troubleshooting. Also, remember the firewall concept we demonstrated here!
In this candid blog, we will explore a number of those perks that make phData one of the best employers in the world. Here are a few of our most popular certifications: Snowflake Data Cloud AWS Dataiku dbt Fivetran Tableau Sigma Computing PowerBI Plus many more! That was the idea behind our Content Palooza program.
In this blog, I’ll share my experience attending, highlight some exciting awards, and unpack all the exciting updates from the event. BI Tool Integration: A new dbt Semantic Layer connection to PowerBI is coming soon! For example, you can add these dbt Health Tiles to your Tableau Dashboard.
In this blog post, we will explore how to get a Data Analyst job as a Fresher. Accordingly, the blog will explore the skills and tools required for a career in data analysis, the importance of building a strong educational foundation, and strategies for getting a job in data analysis as a fresher.
Pickl.AI’s Data Science Course is structured into 11 modules, covering everything from SQL and Tableau to Machine Learning techniques. Focus on Data Science Tools : Access high-demand tools like Tableau and PowerBI. This diploma-oriented course covers core Data Analysis, probability, and Tableau concepts.
Here are steps you can follow to pursue a career as a BI Developer: Acquire a solid foundation in data and analytics: Start by building a strong understanding of data concepts, relational databases, SQL (Structured Query Language), and data modeling.
Analytics can be a powerful tool in this process, helping manufacturers to identify trends, optimize processes, and make informed decisions. In this blog, we’ll take a closer look into how analytics can be useful in manufacturing. In Conclusion Analytics is a powerful asset that can be used in many different ways in manufacturing.
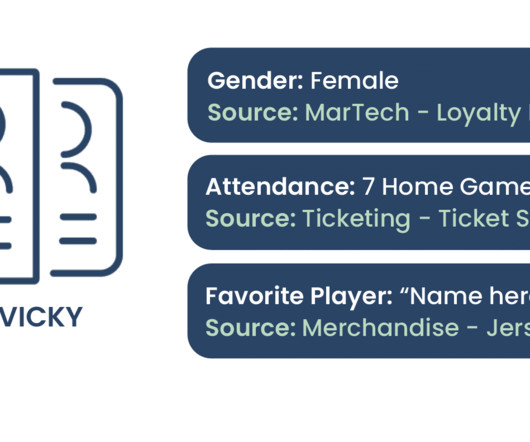
This blog was written by Sara Price and edited by Sunny Yan. In this blog, we’ll demonstrate how to utilize data to drive successful targeted and personalized campaigns for your fanbase to increase revenue, boost operational efficiency, and improve cross-departmental collaboration—all while providing an enriched fan experience.
Later, BI tools such as Chartio, Looker, and Tableau arrived on the data scene. Powered by cloud computing, more data professionals have access to the data, too. Data analysts have access to the data warehouse using BI tools like Tableau; data scientists have access to data science tools, such as Dataiku.
Data Visualization: Matplotlib, Seaborn, Tableau, etc. Read Blog Data Engineering Interview Questions and Answers Role of Data Engineers Data Engineers are the architects of data infrastructure. Excel, Tableau, PowerBI, SQL Server, MySQL, Google Analytics, etc. Big Data Technologies: Hadoop, Spark, etc.
This comprehensive blog outlines vital aspects of Data Analyst interviews, offering insights into technical, behavioural, and industry-specific questions. Yes, I am proficient in data visualisation tools such as Tableau, PowerBI, and Matplotlib in Python, which I use to create interactive and insightful visualisations for data analysis.
If you, too, are looking to make a career as a data professional, this blog will take you through some of the best-paying cities for Data Scientists. The hockey stick growth of Data Scientist salary in India is one of the contributing reasons to make it the most preferred career choice. Let’s unveil the answer in the next segment.
This blog explores their responsibilities, challenges, and career advancement opportunities in detail. This blog will explore the essential aspects of being an Operations Analyst, including core responsibilities, emerging trends, required skills, common challenges, and career growth opportunities.
This blog will highlight the key difference between the two: Key Takeaways Data Analysts extract insights; Business Analysts apply them to business needs. Tableau, PowerBI). Both roles need strong analytical skills, but with different focuses. Statistical Analysis : Using statistical methods to accurately interpret data.
Introduction Business Intelligence (BI) architecture is a crucial framework that organizations use to collect, integrate, analyze, and present business data. This architecture serves as a blueprint for BI initiatives, ensuring that data-driven decision-making is efficient and effective.
We organize all of the trending information in your field so you don't have to. Join 17,000+ users and stay up to date on the latest articles your peers are reading.
You know about us, now we want to get to know you!
Let's personalize your content
Let's get even more personalized
We recognize your account from another site in our network, please click 'Send Email' below to continue with verifying your account and setting a password.


Let's personalize your content