This site uses cookies to improve your experience. To help us insure we adhere to various privacy regulations, please select your country/region of residence. If you do not select a country, we will assume you are from the United States. Select your Cookie Settings or view our Privacy Policy and Terms of Use.
Cookie Settings
Cookies and similar technologies are used on this website for proper function of the website, for tracking performance analytics and for marketing purposes. We and some of our third-party providers may use cookie data for various purposes. Please review the cookie settings below and choose your preference.
Used for the proper function of the website
Used for monitoring website traffic and interactions
Cookie Settings
Cookies and similar technologies are used on this website for proper function of the website, for tracking performance analytics and for marketing purposes. We and some of our third-party providers may use cookie data for various purposes. Please review the cookie settings below and choose your preference.
Strictly Necessary: Used for the proper function of the website
Performance/Analytics: Used for monitoring website traffic and interactions
The primary aim is to make sense of the vast amounts of data generated daily by combining statistical analysis, programming, and data visualization. It is divided into three primary areas: datapreparation, data modeling, and data visualization.
Home Table of Contents Credit Card Fraud Detection Using Spectral Clustering Understanding Anomaly Detection: Concepts, Types and Algorithms What Is Anomaly Detection? By leveraging anomaly detection, we can uncover hidden irregularities in transaction data that may indicate fraudulent behavior.
In the first part of our Anomaly Detection 101 series, we learned the fundamentals of Anomaly Detection and saw how spectral clustering can be used for credit card fraud detection. This method helps in identifying fraudulent transactions by grouping similar data points and detecting outliers. detection of potential failures or issues).
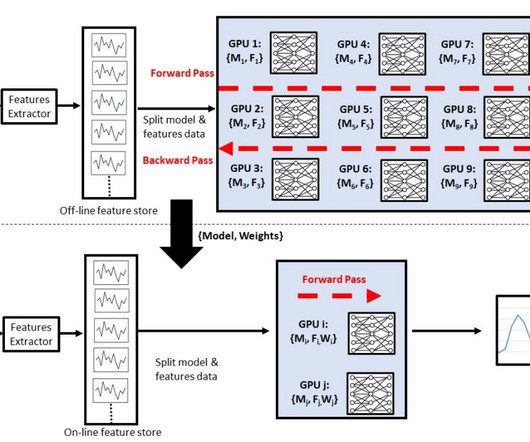
Learning means identifying and capturing historical patterns from the data, and inference means mapping a current value to the historical pattern. The following figure illustrates the idea of a large cluster of GPUs being used for learning, followed by a smaller number for inference.
Data scientists can best improve LLM performance on specific tasks by feeding them the right dataprepared in the right way. Representation models encode meaningful features from raw data for use in classification, clustering, or information retrieval tasks. Book a demo today.
Data scientists can best improve LLM performance on specific tasks by feeding them the right dataprepared in the right way. Representation models encode meaningful features from raw data for use in classification, clustering, or information retrieval tasks. Book a demo today.
You need data engineering expertise and time to develop the proper scripts and pipelines to wrangle, clean, and transform data. Afterward, you need to manage complex clusters to process and train your ML models over these large-scale datasets. These features can find temporal patterns in the data that can influence the baseFare.
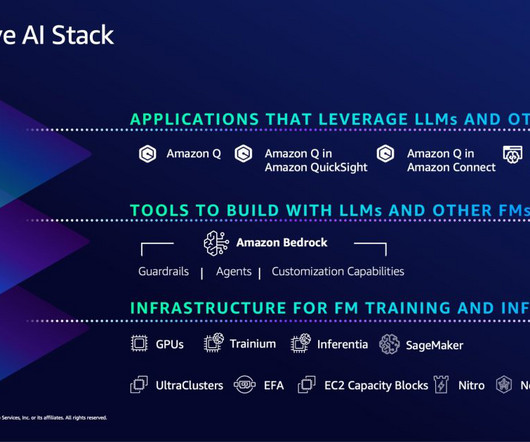
Nobody else offers this same combination of choice of the best ML chips, super-fast networking, virtualization, and hyper-scale clusters. This typically involves a lot of manual work cleaning data, removing duplicates, enriching and transforming it. And Amazon Bedrock can help with this challenge.
They can engage users in natural dialogue, provide customer support, answer FAQs, and assist with booking or shopping decisions. Data Management Costs Data Collection : Involves sourcing diverse datasets, including multilingual and domain-specific corpora, from various digital sources, essential for developing a robust LLM.
This strategic decision was driven by several factors: Efficient datapreparation Building a high-quality pre-training dataset is a complex task, involving assembling and preprocessing text data from various sources, including web sources and partner companies. The team opted for fine-tuning on AWS.
It groups similar data points or identifies outliers without prior guidance. Type of Data Used in Each Approach Supervised learning depends on data that has been organized and labeled. This datapreparation process ensures that every example in the dataset has an input and a known output.
We will start by setting up libraries and datapreparation. Inside you'll find my hand-picked tutorials, books, courses, and libraries to help you master CV and DL! Building a Network Intrusion Detection System Using VAEs In this section, we will see how we can use VAEs for building a network intrusion detection system.
We organize all of the trending information in your field so you don't have to. Join 17,000+ users and stay up to date on the latest articles your peers are reading.
You know about us, now we want to get to know you!
Let's personalize your content
Let's get even more personalized
We recognize your account from another site in our network, please click 'Send Email' below to continue with verifying your account and setting a password.


Let's personalize your content