This site uses cookies to improve your experience. To help us insure we adhere to various privacy regulations, please select your country/region of residence. If you do not select a country, we will assume you are from the United States. Select your Cookie Settings or view our Privacy Policy and Terms of Use.
Cookie Settings
Cookies and similar technologies are used on this website for proper function of the website, for tracking performance analytics and for marketing purposes. We and some of our third-party providers may use cookie data for various purposes. Please review the cookie settings below and choose your preference.
Used for the proper function of the website
Used for monitoring website traffic and interactions
Cookie Settings
Cookies and similar technologies are used on this website for proper function of the website, for tracking performance analytics and for marketing purposes. We and some of our third-party providers may use cookie data for various purposes. Please review the cookie settings below and choose your preference.
Strictly Necessary: Used for the proper function of the website
Performance/Analytics: Used for monitoring website traffic and interactions
ArticleVideo Book This article was published as a part of the Data Science Blogathon Introduction Hello, Welcome to the world of EDA using DataVisualization. The post Exploratory DataAnalysis using DataVisualization Techniques! appeared first on Analytics Vidhya.
ArticleVideo Book This article was published as a part of the Data Science Blogathon Photo by fauxels from Pexels What is Exploratory DataAnalysis? The post Exploratory DataAnalysis and Visualization Techniques in Data Science appeared first on Analytics Vidhya. Exploratory.
ArticleVideo Book This article was published as a part of the Data Science Blogathon Introduction Sometimes it is just convenient to leave the driving to. The post Uber and Lyft Cab Prices : DataAnalysis and Visualization appeared first on Analytics Vidhya.
ArticleVideo Book This article was published as a part of the Data Science Blogathon. The post Beginners Guide to Explanatory DataAnalysis appeared first on Analytics Vidhya. Introduction As we all know there are certain processes to.
ArticleVideo Book This article was published as a part of the Data Science Blogathon. Topic to be covered What is Exploratory DataAnalysis What. The post Top Python Libraries to Automate Exploratory DataAnalysis in 2021 appeared first on Analytics Vidhya.
ArticleVideo Book This article was published as a part of the Data Science Blogathon. The post Mastering Exploratory DataAnalysis(EDA) For Data Science Enthusiasts appeared first on Analytics Vidhya. Overview Step by Step approach to Perform EDA Resources Like.
ArticleVideo Book This article was published as a part of the Data Science Blogathon Introduction Exploratory DataAnalysis or EDA is a vital step in. The post Using Seaborn’s FacetGrid Based Methods for Exploratory DataAnalysis appeared first on Analytics Vidhya.
ArticleVideo Book This article was published as a part of the Data Science Blogathon Overview Python Pandas library is becoming most popular between data scientists. The post EDA – Exploratory DataAnalysis Using Python Pandas and SQL appeared first on Analytics Vidhya.
In this blog, we will discuss exploratory dataanalysis, also known as EDA, and why it is important. We will also be sharing code snippets so you can try out different analysis techniques yourself. This can be useful for identifying patterns and trends in the data. So, without any further ado let’s dive right in.
ArticleVideo Book This article was published as a part of the Data Science Blogathon Exploratory DataAnalysis, or EDA, is an important step in any. The post Exploratory DataAnalysis (EDA) – A step by step guide appeared first on Analytics Vidhya.
ArticleVideo Book This article was published as a part of the Data Science Blogathon . The post Covid-19 Vaccination: DataAnalysis & Visualization appeared first on Analytics Vidhya.
ArticleVideo Book This article was published as a part of the Data Science Blogathon Introduction Exploratory dataanalysis is an approach to analyzing data sets. The post Exploratory DataAnalysis : A Beginners Guide To Perform EDA appeared first on Analytics Vidhya.
ArticleVideo Book This article was published as a part of the Data Science Blogathon Introduction Many engineers have never worked in statistics or data science. The post Know the basics of Exploratory DataAnalysis appeared first on Analytics Vidhya.
ArticleVideo Book This article was published as a part of the Data Science Blogathon Introduction : As the title suggests, we will be exploring data. The post Walk Through of Haberman Cancer Survival Dataset Exploratory DataAnalysis appeared first on Analytics Vidhya.
This means that you can use natural language prompts to perform advanced dataanalysis tasks, generate visualizations, and train machine learning models without the need for complex coding knowledge. Data manipulation: You can use the plugin to perform data cleaning, transformation, and feature engineering tasks.
Imagine walking into a vast library, with an overwhelming number of books filled with complex and intricate narratives. That’s akin to the experience of sifting through today’s digital news landscape, except instead of a magical test, we have the power of dataanalysis to help us find the news that matters most to us.
ArticleVideo Book Understand the ML best practice and project roadmap When a customer wants to implement ML(Machine Learning) for the identified business problem(s) after. The post Rapid-Fire EDA process using Python for ML Implementation appeared first on Analytics Vidhya.
From data collection to dataanalysis and presentation, this blog will cover it all. Google Scholar – Google Scholar is a search engine for scholarly literature, including articles, theses, books, and conference papers. JSTOR – JSTOR is a digital library of academic journals, books, and primary sources.
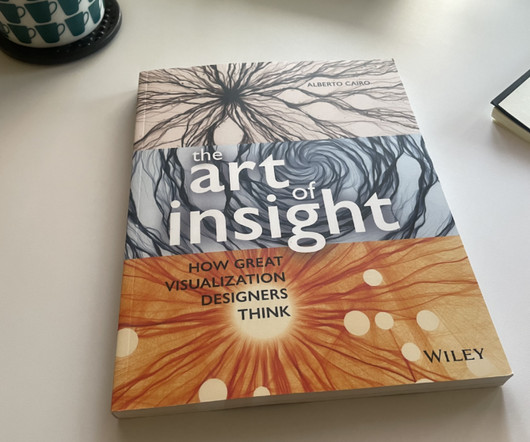
The Art of Insight , by Alberto Cairo, highlights how designers approach visualization with a wide view. In the narrowest view of datavisualization, you use charts to pull quick, quantitative information from dashboards and reports. Take a few steps back and you get exploratory dataanalysis and then storytelling.
Introduction Visualizingdata is both an art form and a science. Some books provide their best case on creating a compelling narrative for what makes visualization appealing. Still, these texts may fall short since oftentimes; the research is based on survey data (which does not always reflect truth).
ArticleVideo Book This article was published as a part of the Data Science Blogathon Introduction Hello Readers!! Covid-19 has affected our lives very much in. The post Analyze Covid Vaccination Progress Using Python appeared first on Analytics Vidhya.
This article was published as a part of the Data Science Blogathon Introduction Airbnb is a $75 Billion online marketplace for renting out homes/villas/ private rooms. The website charges a commission (3 to 20 percent, ) for every booking.
Data Science is a field that encompasses various disciplines, including statistics, machine learning, and dataanalysis techniques to extract valuable insights and knowledge from data. It is divided into three primary areas: data preparation, data modeling, and datavisualization.
ArticleVideo Book This article was published as a part of the Data Science Blogathon Introduction: GitHub is one of the most popular version control and. The post Analyzing popular repositories on GitHub appeared first on Analytics Vidhya.
ArticleVideo Book This article was published as a part of the Data Science Blogathon Introduction Python is a versatile language. The post Analyze Cricket Data With Python : A hands-on guide appeared first on Analytics Vidhya. It is used for general.
A data science book: Consider gifting a popular and highly recommended book on data science, such as "Python for DataAnalysis" by Wes McKinney or "The Elements of Statistical Learning" by Trevor Hastie, Robert Tibshirani, and Jerome Friedman. content)>>>1.
Accordingly, Data Analysts use various tools for DataAnalysis and Excel is one of the most common. Significantly, the use of Excel in DataAnalysis is beneficial in keeping records of data over time and enabling datavisualization effectively. What is DataAnalysis?
Using Python, learners can build a command-line or GUI application that allows users to browse available events or travel options and book tickets for specific dates and seats. The system can handle seat availability, generate booking confirmations, and manage payment processing if desired. Happy programming!
As you know, ODSC East brings together some of the best and brightest minds in data science and AI. They are experts in machine learning, NLP, deep learning, data engineering, MLOps, and datavisualization. Jon Krohn Chief Data Scientist | Nebula.io
We decided to cover some of the most important differences between Data Mining vs Data Science in order to finally understand which is which. What is Data Science? Data Science is an activity that focuses on dataanalysis and finding the best solutions based on it. It hosts a dataanalysis competition.
Data Analytics in the Age of AI, When to Use RAG, Examples of DataVisualization with D3 and Vega, and ODSC East Selling Out Soon Data Analytics in the Age of AI Let’s explore the multifaceted ways in which AI is revolutionizing data analytics, making it more accessible, efficient, and insightful than ever before.
Without further ado, let’s dive in to our study… Photograph Via : Steven Yu | Pexels, Pixabay Hello, my previous work Analyzing and Visualizing Earthquake Data Received with USGS API in Python Environment I prepared a new work after 3 weeks. Now, I will be conducting an exploratory dataanalysis study.
Tableau: A datavisualization tool that helps in creating interactive and shareable dashboards. Analytics in marketing involves the systematic analysis of data to gain insights and make informed decisions. Step 3: Analyze data Use tools like Google Analytics and Excel to analyze the data.
Introduction to Pandas – The fundamentals Pandas is a popular and powerful open-source dataanalysis and manipulation library for the Python programming language. It is used by us, almighty data scientists and analysts to work with large datasets, perform complex operations, and create powerful datavisualizations.
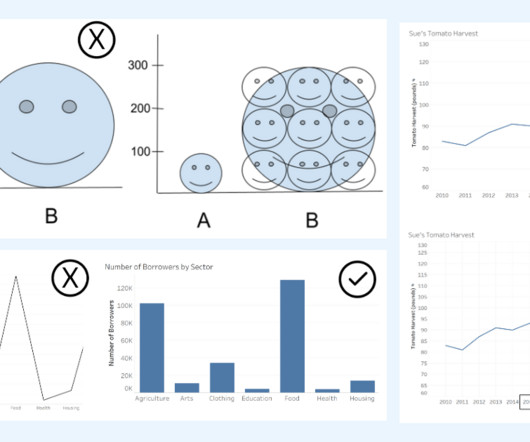
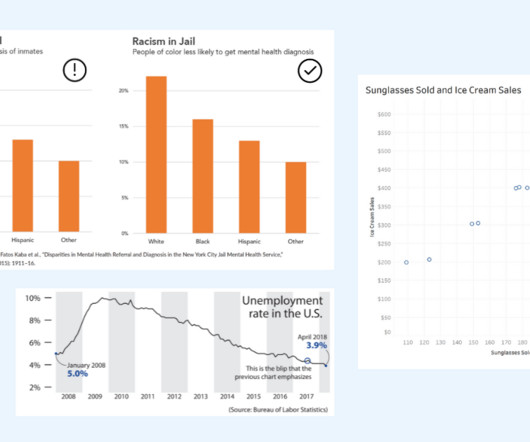
Alberto Cairo, datavisualization expert and author of How Charts Lie Whether you are reading a social post, news article or business report, it’s important to know and evaluate the source of the data and charts that you view. DataVisualization expert and author Kathy Rowell says that we should always ask “Compared to What?”,
DataAnalysis is the process of collecting, cleaning, transforming, and modeling data to extract useful information and insights. In today’s data-driven world, dataanalysis has become an essential skill for organizations across industries to make informed decisions and improve business outcomes.
Inspired by the wildly popular Iron Viz competition from Tableau Conference, Viz Games are an exciting and fun way for any organization to take their skills to the next level while expanding data culture and engagement on dataanalysis. All visualizations were published on Tableau Public.
Inspired by the wildly popular Iron Viz competition from Tableau Conference, Viz Games are an exciting and fun way for any organization to take their skills to the next level while expanding data culture and engagement on dataanalysis. All visualizations were published on Tableau Public.
By acquiring expertise in statistical techniques, machine learning professionals can develop more advanced and sophisticated algorithms, which can lead to better outcomes in dataanalysis and prediction. It is essential to delve deeply into programming books and explore new concepts to gain a competitive edge in the field.
This step is crucial for eliminating inconsistencies and ensuring data integrity. DataAnalysisDataanalysis is the heart of deriving insights from the gathered information. DataVisualizationDatavisualization transforms complex data sets into intuitive and visually appealing representations.
” Expedia Expedia is not just a plugin; it’s a virtual travel agent that takes care of everything from booking your flights and securing rental cars to finding the perfect accommodations and even planning your entire trip itinerary. Prompt example : “What are some critically acclaimed books similar to ‘1984’?”
The key is to think critically and take time to evaluate the interpretations of data portrayed in charts. DataVisualization expert and author Kathy Rowell says that we should always ask “Compared to What?” Is the interpretation appropriate for the dataanalysis shown? Image from How Charts Lie by Alberto Cairo.
For instance, in a flight booking application, a developer can create an agent that can remember the last time you traveled or that you opt for a vegetarian meal. Now agents can retain memory across multiple interactions to remember where you last left off and provide better recommendations based on prior interactions.
Using sophisticated datavisualization tools, many of which are powered by AI, app analytics services empower businesses to better understand IT operations , helping teams make smarter decisions, faster. AI in SaaS analytics Most industries have had to reckon with AI proliferation and AI-driven business practices to some extent.
We organize all of the trending information in your field so you don't have to. Join 17,000+ users and stay up to date on the latest articles your peers are reading.
You know about us, now we want to get to know you!
Let's personalize your content
Let's get even more personalized
We recognize your account from another site in our network, please click 'Send Email' below to continue with verifying your account and setting a password.


Let's personalize your content