This site uses cookies to improve your experience. To help us insure we adhere to various privacy regulations, please select your country/region of residence. If you do not select a country, we will assume you are from the United States. Select your Cookie Settings or view our Privacy Policy and Terms of Use.
Cookie Settings
Cookies and similar technologies are used on this website for proper function of the website, for tracking performance analytics and for marketing purposes. We and some of our third-party providers may use cookie data for various purposes. Please review the cookie settings below and choose your preference.
Used for the proper function of the website
Used for monitoring website traffic and interactions
Cookie Settings
Cookies and similar technologies are used on this website for proper function of the website, for tracking performance analytics and for marketing purposes. We and some of our third-party providers may use cookie data for various purposes. Please review the cookie settings below and choose your preference.
Strictly Necessary: Used for the proper function of the website
Performance/Analytics: Used for monitoring website traffic and interactions
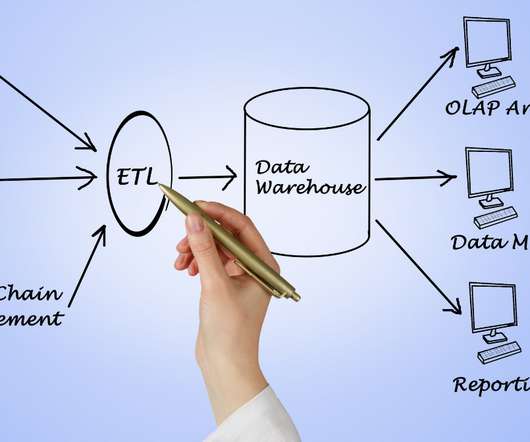
By utilizing algorithms and statistical models, data mining transforms raw data into actionable insights. The data mining process The data mining process is structured into four primary stages: data gathering, datapreparation, data mining, and dataanalysis and interpretation.
By analyzing data from IoT devices, organizations can perform maintenance tasks proactively, reducing downtime and operational costs. DatapreparationDatapreparation is a crucial step that includes data cleaning, transforming, and structuring historical data for analysis.
In the sales context, this ensures that sales data remains consistent, accurate, and easily accessible for analysis and reporting. Power BI: Power BI, integrated within Microsoft Fabric, is a leading BusinessIntelligence tool that facilitates advanced data visualization and reporting.
In addition, several enterprises are using AI-enabled programs to get business analytics insights from volumes of complex data coming from various sources. AI is undoubtedly a gamechanger for businessintelligence. Most organizations base their decisions on what data tells them. It makes datapreparation faster.
Introduction Data visualization is no longer just a niche skill; it’s a fundamental component of DataAnalysis , businessintelligence, and data science. Q1: What is data visualization, and why is it important in DataAnalysis? How would you approach this?
Generative Visualizations : The AI generates appropriate visualizations based on the user’s query, automatically selecting the best chart types, layouts, and data representations to convey the requested insights. This capability automates much of the manual work traditionally involved in data analytics.
Analytics Data lakes give various positions in your company, such as data scientists, data developers, and business analysts, access to data using the analytical tools and frameworks of their choice. You can perform analytics with Data Lakes without moving your data to a different analytics system. 4.
Online analytical processing (OLAP) database systems and artificial intelligence (AI) complement each other and can help enhance dataanalysis and decision-making when used in tandem. Organizations can expect to reap the following benefits from implementing OLAP solutions, including the following.
What Is a Data Catalog? A data catalog is a centralized storage bank of metadata on information sources from across the enterprise, such as: Datasets. Businessintelligence reports. The data catalog also stores metadata (data about data, like a conversation), which gives users context on how to use each asset.
Summary: Power BI alternatives like Tableau, Qlik Sense, and Zoho Analytics provide businesses with tailored DataAnalysis and Visualisation solutions. Selecting the right alternative ensures efficient data-driven decision-making and aligns with your organisation’s goals and budget. billion to USD 54.27 What is Power BI?
They all agree that a Datamart is a subject-oriented subset of a data warehouse focusing on a particular business unit, department, subject area, or business functionality. The Datamart’s data is usually stored in databases containing a moving frame required for dataanalysis, not the full history of data.
Most businesses already recognize the need to automate the actual analysis of data, but you can go further. Automating the datapreparation and interpretation phases will take much time and effort out of the equation, too.
This includes duplicate removal, missing value treatment, variable transformation, and normalization of data. Tools like Python (with pandas and NumPy), R, and ETL platforms like Apache NiFi or Talend are used for datapreparation before analysis.
By integrating AI capabilities, Excel can now automate DataAnalysis, generate insights, and even create visualisations with minimal human intervention. AI-powered features in Excel enable users to make data-driven decisions more efficiently, saving time and effort while uncovering valuable insights hidden within large datasets.
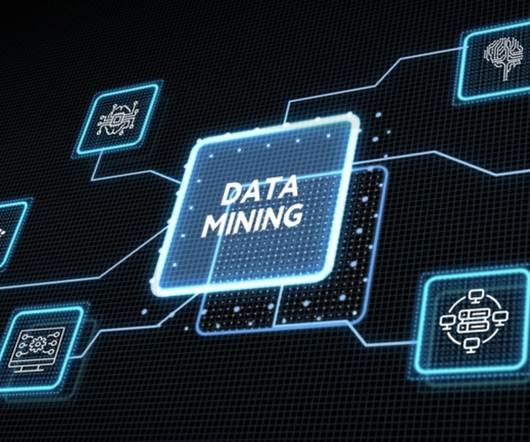
Understanding the appropriate ways to use data remains critical to success in finance, education and commerce. Accordingly, data collection from numerous sources is essential before dataanalysis and interpretation. Furthermore, data mining can help organisations better understand their customers.
Discover best practices for successful implementation and propel your organization towards data-driven success. Introduction to Power BI Project s The world of DataAnalysis is constantly evolving, and Power BI stands at the forefront of this transformation. Power BI has transcended its initial role as a reporting tool.
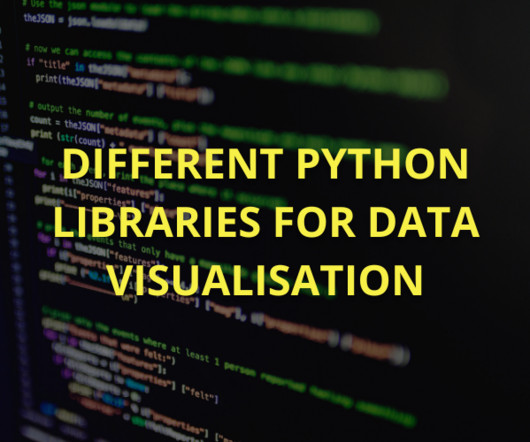
Choosing the proper library improves data exploration, presentation, and industry decision-making. Introduction Data visualisation plays a crucial role in DataAnalysis by transforming complex datasets into insightful, easy-to-understand visuals. It helps uncover patterns, trends, and correlations that might go unnoticed.
Optimising Power BI reports for performance ensures efficient dataanalysis. Power BI proficiency opens doors to lucrative data analytics and businessintelligence opportunities, driving organisational success in today’s data-driven landscape. How does Power Query help in datapreparation?
Data Pipeline Orchestration: Managing the end-to-end data flow from data sources to the destination systems, often using tools like Apache Airflow, Apache NiFi, or other workflow management systems. It covers Data Engineering aspects like datapreparation, integration, and quality.
Inconsistent or unstructured data can lead to faulty insights, so transformation helps standardise data, ensuring it aligns with the requirements of Analytics, Machine Learning , or BusinessIntelligence tools. This makes drawing actionable insights, spotting patterns, and making data-driven decisions easier.
We are living in a world where data drives decisions. Also, it is making transformative changes across the business nations. Data manipulation in Data Science is the fundamental process in dataanalysis. Does not alter the original data; instead, it creates new representations or summaries of the data.
Microsoft Power BI Microsoft Power BI is almost synonymous with comprehensive businessintelligence capabilities. Like our other platform, it allows users to connect to hundreds of data sources, simplify data prep, and drive ad hoc analysis.
Summary: Statistical Modeling is essential for DataAnalysis, helping organisations predict outcomes and understand relationships between variables. Introduction Statistical Modeling is crucial for analysing data, identifying patterns, and making informed decisions. Datapreparation also involves feature engineering.
In the world of Machine Learning and DataAnalysis , decision trees have emerged as powerful tools for making complex decisions and predictions. These tree-like structures break down a problem into smaller, manageable parts, enabling us to make informed choices based on data.
Data Manipulation The process through which you can change the data according to your project requirement for further dataanalysis is known as Data Manipulation. The entire process involves cleaning, Merging and changing the data format. This data can help in building the project pipeline.
AI technology is quickly proving to be a critical component of businessintelligence within organizations across industries. Automated development: With AutoAI , beginners can quickly get started and more advanced data scientists can accelerate experimentation in AI development. trillion in value.
This helps facilitate data-driven decision-making for businesses, enabling them to operate more efficiently and identify new opportunities. Definition and significance of data science The significance of data science cannot be overstated. Data visualization developer: Creates interactive dashboards for dataanalysis.
KDD provides a structured framework to convert raw data into actionable knowledge. The KDD process Data gathering DatapreparationData mining Dataanalysis and interpretation Data mining process components Understanding the components of the data mining process is essential for effective implementation.
This modular approach allows businesses to assemble tools and techniques that perfectly fit their specific needs, rather than relying on less flexible monolithic systems. Composable analytics refers to an agile, adaptable framework for data analytics that allows users to create customized analytical environments using modular components.
As a software suite, it encompasses a range of interconnected products, including Tableau Desktop, Server, Cloud, Public, Prep, and Data Management, and Reader. At its core, it is designed to help people see and understand data. It disrupts traditional businessintelligence with intuitive, visual analytics for everyone.
Stefanie Molin, Data Scientist, Software Engineer, Author of Hands-On DataAnalysis with Pandas at Bloomberg Stefanie Molin is a software engineer and data scientist at Bloomberg, where she tackles complex information security challenges through data wrangling, visualization, and tool development.
We organize all of the trending information in your field so you don't have to. Join 17,000+ users and stay up to date on the latest articles your peers are reading.
You know about us, now we want to get to know you!
Let's personalize your content
Let's get even more personalized
We recognize your account from another site in our network, please click 'Send Email' below to continue with verifying your account and setting a password.


Let's personalize your content