This site uses cookies to improve your experience. To help us insure we adhere to various privacy regulations, please select your country/region of residence. If you do not select a country, we will assume you are from the United States. Select your Cookie Settings or view our Privacy Policy and Terms of Use.
Cookie Settings
Cookies and similar technologies are used on this website for proper function of the website, for tracking performance analytics and for marketing purposes. We and some of our third-party providers may use cookie data for various purposes. Please review the cookie settings below and choose your preference.
Used for the proper function of the website
Used for monitoring website traffic and interactions
Cookie Settings
Cookies and similar technologies are used on this website for proper function of the website, for tracking performance analytics and for marketing purposes. We and some of our third-party providers may use cookie data for various purposes. Please review the cookie settings below and choose your preference.
Strictly Necessary: Used for the proper function of the website
Performance/Analytics: Used for monitoring website traffic and interactions
While different companies, regardless of their size, have different operational processes, they share a common need for actionable insight to drive success in their business. Advancement in big data technology has made the world of business even more competitive. This eliminates guesswork when coming up with business strategies.
Top 10 Professions in Data Science: Below, we provide a list of the top data science careers along with their corresponding salary ranges: 1. Data Scientist Data scientists are responsible for designing and implementing datamodels, analyzing and interpreting data, and communicating insights to stakeholders.
This week, Gartner published the 2021 Magic Quadrant for Analytics and BusinessIntelligence Platforms. I first want to thank you, the Tableau Community, for your continued support and your commitment to data, to Tableau, and to each other. Francois Ajenstat. Kristin Adderson. January 27, 2021 - 4:36pm. February 18, 2021.
Summary: BusinessIntelligence Analysts transform raw data into actionable insights. They use tools and techniques to analyse data, create reports, and support strategic decisions. Key skills include SQL, data visualization, and business acumen. Introduction We are living in an era defined by data.
In today’s fast-paced business landscape, companies need to stay ahead of the curve to remain competitive. Businessintelligence (BI) has emerged as a key solution to help companies gain insights into their operations and market trends. What is businessintelligence?
In today’s fast-paced business landscape, companies need to stay ahead of the curve to remain competitive. Businessintelligence (BI) has emerged as a key solution to help companies gain insights into their operations and market trends. What is businessintelligence?
Apache Spark: Apache Spark is an open-source, unified analytics engine designed for big data processing. It provides high-speed, in-memory data processing capabilities and supports various programming languages like Scala, Java, Python, and R. It can handle both batch and real-time data processing tasks efficiently.
Once you provide relevant prompts of focus to the GPT, it can generate appropriate data visuals based on the information from the uploaded files. It is capable of writing and running Python codes. Other than the advanced data analysis, it can also deal with image conversions.
Swetha Bezawada Senior Data Scientist Colten Woo September 26, 2023 - 6:57pm October 2, 2023 The typical analytical ecosystem has two silos: businessintelligence and data science. Leveraging the code editor in the data source tab, you can write custom Python, R, or Javascript code.
This week, Gartner published the 2021 Magic Quadrant for Analytics and BusinessIntelligence Platforms. I first want to thank you, the Tableau Community, for your continued support and your commitment to data, to Tableau, and to each other. Francois Ajenstat. Kristin Adderson. January 27, 2021 - 4:36pm. February 18, 2021.
Most submissions utilized popular Python libraries like geopandas , rasterio , xarray , and matplotlib. EE Frogs H2plastic Hunatek-Kalman Spatial Clan Viva Aqua Community Code Bonus Prize Katso Obotsang (username Katso ) won the Community Code Bonus Prize for the post "Creating a visualization from your csv file in Python".
Swetha Bezawada Senior Data Scientist Colten Woo September 26, 2023 - 6:57pm October 2, 2023 The typical analytical ecosystem has two silos: businessintelligence and data science. Leveraging the code editor in the data source tab, you can write custom Python, R, or Javascript code.
What is BusinessIntelligence? BusinessIntelligence (BI) refers to the technology, techniques, and practises that are used to gather, evaluate, and present information about an organisation in order to assist decision-making and generate effective administrative action. billion in 2015 and reached around $26.50
Once you provide relevant prompts of focus to the GPT, it can generate appropriate data visuals based on the information from the uploaded files. It is capable of writing and running Python codes. Other than the advanced data analysis, it can also deal with image conversions.
Once you provide relevant prompts of focus to the GPT, it can generate appropriate data visuals based on the information from the uploaded files. It is capable of writing and running Python codes. Other than the advanced data analysis, it can also deal with image conversions.
This blog highlights some of the most impactful AI slides from the world’s best data science instructors, focusing on cutting-edge advancements in AI, datamodeling, and deployment strategies. Here’s a breakdown of ten top sessions from this year’s conference that data professionals should consider.
Data analytics is a task that resides under the data science umbrella and is done to query, interpret and visualize datasets. Data scientists will often perform data analysis tasks to understand a dataset or evaluate outcomes. And you should have experience working with big data platforms such as Hadoop or Apache Spark.
Employing a modular structure, SAP ERP encompasses modules such as finance, human resources, supply chain , and more, facilitating real-time collaboration and data sharing across different departments through a centralized database. SAP is relatively easy to work with.
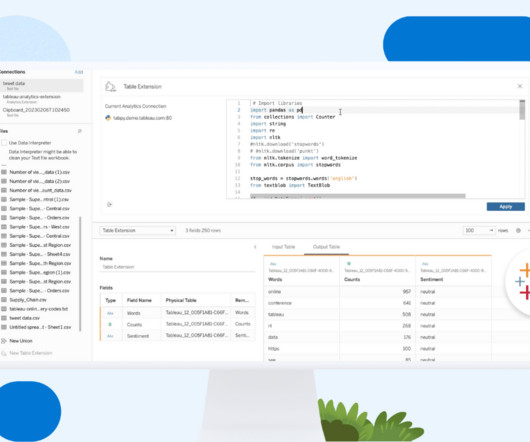
Tableau is an interactive platform that enables users to analyse and visualise data to gain insights. How Professionals Can Use Tableau for Data Science? Tableau is a powerful data visualization and businessintelligence tool that can be effectively used by professionals in the field of data science.
Key Takeaways Operations Analysts optimise efficiency through data-driven decision-making. Expertise in tools like Power BI, SQL, and Python is crucial. Expertise in programs like Microsoft Excel, SQL , and businessintelligence (BI) tools like Power BI or Tableau allows analysts to process and visualise data efficiently.
The traditional data science workflow , as defined by Joe Blitzstein and Hanspeter Pfister of Harvard University, contains 5 key steps: Ask a question. Get the data. Explore the data. Model the data. A data catalog can assist directly with every step, but model development. Explore the Data.
Join me in understanding the pivotal role of Data Analysts , where learning is not just an option but a necessity for success. Key takeaways Develop proficiency in Data Visualization, Statistical Analysis, Programming Languages (Python, R), Machine Learning, and Database Management.
Data Scientist Involves advanced analysis of complex datasets to extract insights and create predictive models. Python, R), Machine Learning, statistical modelling, Data Visualisation Pursue advanced degrees, participate in hackathons, and build a strong online presence by sharing projects on platforms like GitHub.
The result of this assessment process led to conceptualizing and designing a framework that offers an environment for building, managing, and automating processes or workflows with which the data, models, and code Ops based on the needs of individuals and across teams can be realized. CloudWatch for cost tracking. sm_client = boto3.client(
Developers can add custom functions, define new data types, and create custom plugins for specific use cases. Its ability to integrate with languages like Python, Java, and Perl makes it a favourite for projects that require flexibility. PostgreSQLs architecture is highly flexible, supporting many datamodels and workloads.
Summary: Data engineering tools streamline data collection, storage, and processing. Tools like Python, SQL, Apache Spark, and Snowflake help engineers automate workflows and improve efficiency. Learning these tools is crucial for building scalable data pipelines.
We organize all of the trending information in your field so you don't have to. Join 17,000+ users and stay up to date on the latest articles your peers are reading.
You know about us, now we want to get to know you!
Let's personalize your content
Let's get even more personalized
We recognize your account from another site in our network, please click 'Send Email' below to continue with verifying your account and setting a password.


Let's personalize your content