This site uses cookies to improve your experience. To help us insure we adhere to various privacy regulations, please select your country/region of residence. If you do not select a country, we will assume you are from the United States. Select your Cookie Settings or view our Privacy Policy and Terms of Use.
Cookie Settings
Cookies and similar technologies are used on this website for proper function of the website, for tracking performance analytics and for marketing purposes. We and some of our third-party providers may use cookie data for various purposes. Please review the cookie settings below and choose your preference.
Used for the proper function of the website
Used for monitoring website traffic and interactions
Cookie Settings
Cookies and similar technologies are used on this website for proper function of the website, for tracking performance analytics and for marketing purposes. We and some of our third-party providers may use cookie data for various purposes. Please review the cookie settings below and choose your preference.
Strictly Necessary: Used for the proper function of the website
Performance/Analytics: Used for monitoring website traffic and interactions
This article was published as a part of the DataScience Blogathon. Introduction to Tableau Tips! Creating a chart or visual in Tableau is. The post 5 Tableau Tips for Designing a Tidy and Impactful Visualization appeared first on Analytics Vidhya.
This article was published as a part of the DataScience Blogathon. Introduction Tableau is a data visualization tool created in Salesforce that allows users to connect to any database, like SQL or MongoDB, and interact freely.
Das Format Business Talk am Kudamm in Berlin führte ein Interview mit Benjamin Aunkofer zum Thema “BusinessIntelligence und Process Mining nachhaltig umsetzen”. Für DataScience ja sowieso. von PowerBI nach Tableau oder SuperSet zu wechseln, von Celonis nach Signavio oder welches Tool auch immer.
Overview There are a plethora of datascience tools out there – which one should you pick up? The post 22 Widely Used DataScience and Machine Learning Tools in 2020 appeared first on Analytics Vidhya. Here’s a list of over 20.
Or regularly build dashboards and visualizations in Tableau or Power BI? The post Infographic: 11 Steps to Transition into DataScience (for Reporting / MIS / BI Professionals) appeared first on Analytics Vidhya. Introduction Do you often work with reports in Excel? If you answered yes.
What’s the best BusinessIntelligence and Analytics tool in the market? A plethora of datascience and businessintelligence professionals and organizations have asked. The post Gartner’s 2020 Magic Quadrant is Out!
ArticleVideo Book This article was published as a part of the DataScience Blogathon. Introduction Data Visualization is a graphical way to represent data by. The post Make Your Tableau Visuals More Effective – Tips And Tricks appeared first on Analytics Vidhya.
Chief Product Officer, Tableau. Tableau has been named a Leader in the Gartner Magic Quadrant for Analytics & BusinessIntelligence Platforms for the 10th consecutive year. We believe a decade as a Leader is an incredible milestone—and it wouldn’t be possible without you, our amazing Tableau Community. .
Chief Product Officer, Tableau. Tableau has been named a Leader in the Gartner Magic Quadrant for Analytics & BusinessIntelligence Platforms for the 10th consecutive year. We believe a decade as a Leader is an incredible milestone—and it wouldn’t be possible without you, our amazing Tableau Community. .
Ateken Abla March 19, 2024 - 9:05pm Larissa Amoroso Vice President, Tableau Community, Tableau When Karolina Grodzinska took the stage at Tableau Conference as part of her Iron Viz: Student Edition award, it felt like the culmination of her data learning, which started in 2021. How did Karolina discover Tableau? “It
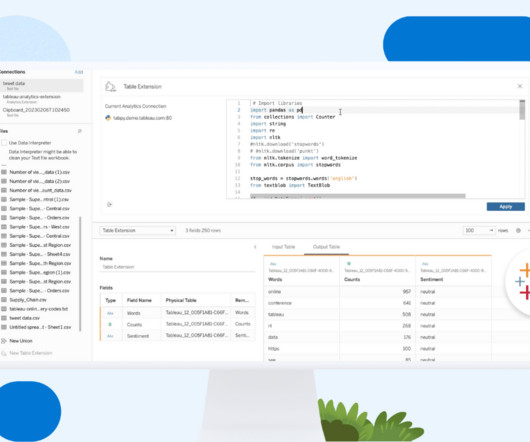
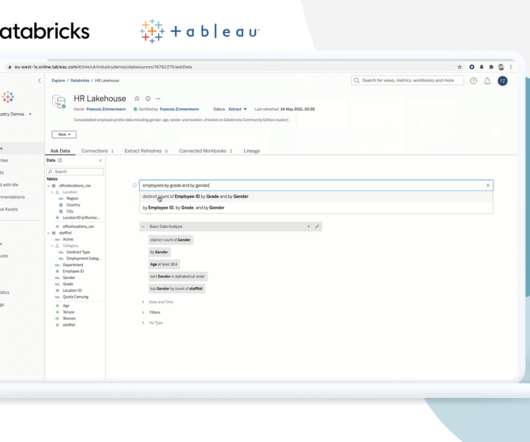
Swetha Bezawada Senior Data Scientist Colten Woo September 26, 2023 - 6:57pm October 2, 2023 The typical analytical ecosystem has two silos: businessintelligence and datascience. At the root, an Analytics Extension is a server that you stand up to receive data from Tableau in real-time.
In addition to BusinessIntelligence (BI), Process Mining is no longer a new phenomenon, but almost all larger companies are conducting this data-driven process analysis in their organization. For analysis the way of BusinessIntelligence this normalized data model can already be used.
It offers pre-built connectors for a wide range of data sources, enabling data engineers to set up data pipelines quickly and easily. Fivetran automates the data extraction, transformation, and loading processes, ensuring reliable and up-to-date data in the target storage.
EMEA Field CTO, Tableau. In many of the conversations we have with IT and business leaders, there is a sense of frustration about the speed of time-to-value for big data and datascience projects. The division between data lakes and data warehouses is stifling innovation. Francois Zimmermann.
Open source businessintelligence software is a game-changer in the world of data analysis and decision-making. It has revolutionized the way businesses approach data analytics by providing cost-effective and customizable solutions that are tailored to specific business needs.
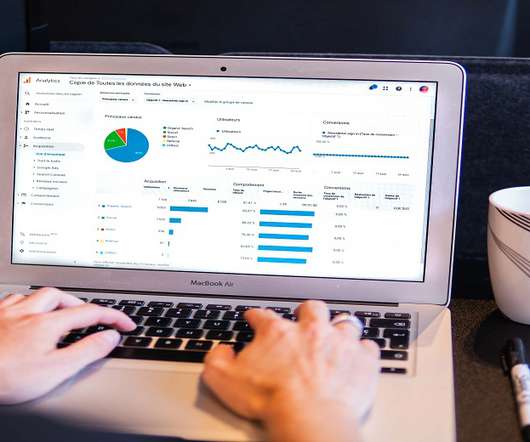
Tableau is a data visualisation software helping you to generate graphics-rich reporting and analysing enormous volumes of data. With the help of Tableau, organisations have been able to mine and gather actionable insights from granular sources of data. Let’s read the blog to find out!
Though you may encounter the terms “datascience” and “data analytics” being used interchangeably in conversations or online, they refer to two distinctly different concepts. Meanwhile, data analytics is the act of examining datasets to extract value and find answers to specific questions.
Swetha Bezawada Senior Data Scientist Colten Woo September 26, 2023 - 6:57pm October 2, 2023 The typical analytical ecosystem has two silos: businessintelligence and datascience. At the root, an Analytics Extension is a server that you stand up to receive data from Tableau in real-time.
ArticleVideo Book This article was published as a part of the DataScience Blogathon. Introduction Data visualization is the practice of translating data into. The post Top 10 Data Visualization Tools appeared first on Analytics Vidhya.
Big Data wurde für viele Unternehmen der traditionellen Industrie zur Enttäuschung, zum falschen Versprechen. Datenqualität hingegen, wurde zum wichtigen Faktor jeder Unternehmensbewertung, was Themen wie Reporting, Data Governance und schließlich dann das Data Engineering mehr noch anschob als die DataScience.
If you’ve found yourself asking, “How to become a data scientist?” In this detailed guide, we’re going to navigate the exciting realm of datascience, a field that blends statistics, technology, and strategic thinking into a powerhouse of innovation and insights. This is where data visualization comes in.
DataScience: Harnessing the Power of Big Data. Marketing and business strategy benefit greatly from data. People who are interested in data and statistics can do very well in a datascience or analytics career. So, what are the best analytics tools for businesses in 2021? RapidMiner.
Tableau : It’s a visual analytics platform that transforms raw data into interactive, real-time dashboards. Looker : It’s a businessintelligence tool that delivers detailed insights about customer behaviors and business performance.
There are many well-known libraries and platforms for data analysis such as Pandas and Tableau, in addition to analytical databases like ClickHouse, MariaDB, Apache Druid, Apache Pinot, Google BigQuery, Amazon RedShift, etc. You can even connect directly to 20+ data sources to work with data within minutes.
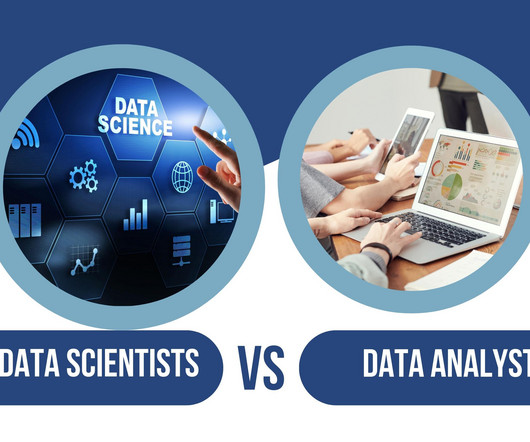
Summary: The difference between DataScience and Data Analytics lies in their approachData Science uses AI and Machine Learning for predictions, while Data Analytics focuses on analysing past trends. DataScience requires advanced coding, whereas Data Analytics relies on statistical methods.
Summary: DataScience appears challenging due to its complexity, encompassing statistics, programming, and domain knowledge. However, aspiring data scientists can overcome obstacles through continuous learning, hands-on practice, and mentorship. However, many aspiring professionals wonder: Is DataScience hard?
EMEA Field CTO, Tableau. In many of the conversations we have with IT and business leaders, there is a sense of frustration about the speed of time-to-value for big data and datascience projects. The division between data lakes and data warehouses is stifling innovation. Francois Zimmermann.
Summary: The blog explores the synergy between Artificial Intelligence (AI) and DataScience, highlighting their complementary roles in Data Analysis and intelligent decision-making. This article explores how AI and DataScience complement each other, highlighting their combined impact and potential.
One of the most demanding fields in the business world today is of DataScience. With numerous job opportunities, DataScience skills have become essential in the market. The easiest skill that a DataScience aspirant might develop is SQL. What is SQL?
If you are still wondering how DataScience will change the future, then the fact of the matter is that it has made significant strides in every business niche in recent years. DataScience is one of the most lucrative career opportunities, thus triggering the demand for Data professionals. Read ahead.
Tools and Techniques Commonly Used Data Analysts rely on various tools to streamline their work. Software like Microsoft Excel and SQL helps them manipulate and query data efficiently. They use data visualisation tools like Tableau and Power BI to create compelling reports. DataScience Certification Course by Pickl.AI
Regardless of if you’re a datascience professional or an IT department who wants to help your company have more successful datascience projects, it’s essential to have some datascience tools under your belt to avail of when needed. Here are some open-source options to consider.
It’s important to build a solid CV by working with businesses and teams that fit a specialization, so choose one. By 2020, over 40 percent of all datascience tasks will be automated. Basic BusinessIntelligence Experience is a Must. Communication happens to be a critical soft skill of businessintelligence.
EVENT — ODSC East 2024 In-Person and Virtual Conference April 23rd to 25th, 2024 Join us for a deep dive into the latest datascience and AI trends, tools, and techniques, from LLMs to data analytics and from machine learning to responsible AI. So get your pass today, and keep yourself ahead of the curve.
Combining large-scale Earth observation data with other data types enabled many participants to better understand specific issues or locales. For example, honorable mention winner DataScience Nigeria combined satellite imagery with reports of violent incidents from ACLED to better identify areas at high risk of hunger.
So let’s take a look at some of the free data visualization tools available, and how they can provide actionable insights that allow for driving informed decision-making and strategic planning while keeping to being user friendly. What sets Tableau apart is its intuitive, user-friendly, drag-and-drop interface.
If you’re an aspiring professional in the technological world and love to play with numbers and codes, you have two career paths- Data Analyst and Data Scientist. What are the critical differences between Data Analyst vs Data Scientist? Accordingly, Both these job roles have a huge demand in the market today.
A typical modern data stack consists of the following: A data warehouse. Data ingestion/integration services. Data orchestration tools. Businessintelligence (BI) platforms. These tools are used to manage big data, which is defined as data that is too large or complex to be processed by traditional means.
Analyse your interests: A Data Analyst internship can be an excellent way for you to find your interest in the field. Before making a long-term commitment to a company, you know whether you want to be a businessintelligence or healthcare analyst. The DataScience program by Pickl.AI
hours of on-demand video 5 coding exercises 40 articles and 9 downloadable resources Full access on mobile and TV DataScience Job Guarantee Program by Pickl.AI This year-long program guarantees a job in DataScience , providing both conceptual knowledge and technical proficiency. Course Content: 42.5
The modules that you can complete include data visualization and analysis, data warehousing, prescriptive analysis, predictive analysis and analytics capstone, and you will also have the chance to use software and technology that you will be using in the workplace, such as Tableau, SQL, Python, and SPSS.
Technical Skills In todays data-centric landscape, proficiency in advanced analytics tools and software is crucial for an Operations Analyst. Expertise in programs like Microsoft Excel, SQL , and businessintelligence (BI) tools like Power BI or Tableau allows analysts to process and visualise data efficiently.
Today, companies are facing a continual need to store tremendous volumes of data. The demand for information repositories enabling businessintelligence and analytics is growing exponentially, giving birth to cloud solutions. Data warehousing is a vital constituent of any businessintelligence operation.
We are living in a world where data drives decisions. Also, it is making transformative changes across the business nations. Data manipulation in DataScience is the fundamental process in data analysis. The objective is to enhance the data quality and prepare the data sets for the analysis.
We organize all of the trending information in your field so you don't have to. Join 17,000+ users and stay up to date on the latest articles your peers are reading.
You know about us, now we want to get to know you!
Let's personalize your content
Let's get even more personalized
We recognize your account from another site in our network, please click 'Send Email' below to continue with verifying your account and setting a password.


Let's personalize your content