This site uses cookies to improve your experience. To help us insure we adhere to various privacy regulations, please select your country/region of residence. If you do not select a country, we will assume you are from the United States. Select your Cookie Settings or view our Privacy Policy and Terms of Use.
Cookie Settings
Cookies and similar technologies are used on this website for proper function of the website, for tracking performance analytics and for marketing purposes. We and some of our third-party providers may use cookie data for various purposes. Please review the cookie settings below and choose your preference.
Used for the proper function of the website
Used for monitoring website traffic and interactions
Cookie Settings
Cookies and similar technologies are used on this website for proper function of the website, for tracking performance analytics and for marketing purposes. We and some of our third-party providers may use cookie data for various purposes. Please review the cookie settings below and choose your preference.
Strictly Necessary: Used for the proper function of the website
Performance/Analytics: Used for monitoring website traffic and interactions
If you’ve found yourself asking, “How to become a datascientist?” In this detailed guide, we’re going to navigate the exciting realm of data science, a field that blends statistics, technology, and strategic thinking into a powerhouse of innovation and insights. What is a datascientist?
More and more often, businesses are using data to drive their decisions — which makes cutting-edge analytics and businessintelligence strategies one of the best advantages a company can have. Here are the six trends you should be aware of that will reshape businessintelligence in 2020 and throughout the new decade.
In the sales context, this ensures that sales data remains consistent, accurate, and easily accessible for analysis and reporting. Synapse Data Science: Synapse Data Science empowers datascientists to work directly with secured and governed sales data prepared by engineering teams, allowing for the efficient development of predictive models.
Open source businessintelligence software is a game-changer in the world of data analysis and decision-making. It has revolutionized the way businesses approach data analytics by providing cost-effective and customizable solutions that are tailored to specific business needs.
It is capable of understanding complex relationships in data and creating visual outputs in the form of flowcharts, charts, and sequences. It aims to provide a clear and concise representation of data. PowerBI Wizard It is a popular businessintelligence tool that empowers you to explore data.
Summary : Microsoft Fabric is an end-to-end Data Analytics platform designed for integration, processing, and advanced insights, while PowerBI excels in creating interactive visualisations and reports. Both tools complement each other, enabling seamless data management and visualisation. What is PowerBI?
QGIS, Microsoft's PowerBI, Tableau, and Jupyter notebooks also facilitated many interesting visualizations, particularly for solvers with less programming experience. Many participants used beginner-friendly online interfaces, like NASA Worldview and Giovanni , to explore and manipulate data. He holds a B.S.
It is capable of understanding complex relationships in data and creating visual outputs in the form of flowcharts, charts, and sequences. It aims to provide a clear and concise representation of data. PowerBI Wizard It is a popular businessintelligence tool that empowers you to explore data.
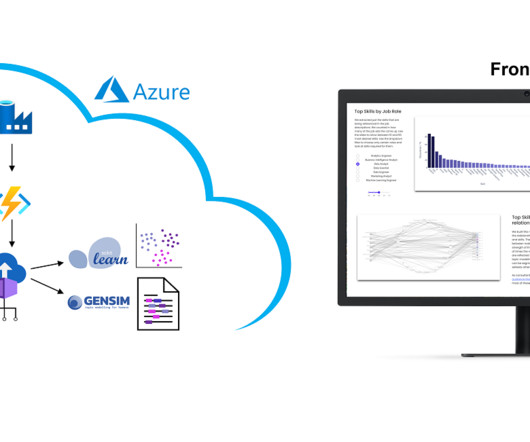
However, we collect these over time and will make trends secure, for example how the demand for Python, SQL or specific tools such as dbt or PowerBI changes. The presentation is currently limited to the current situation on the labor market. Why we did it? It is a nice show-case many people are interested in.
Businessintelligence has a long history. Today, the term describes that same activity, but on a much larger scale, as organizations race to collect, analyze, and act on data first. With remote and hybrid work on the rise, the ability to locate and leverage data and expertise — wherever it resides — is more critical than ever.
It is capable of understanding complex relationships in data and creating visual outputs in the form of flowcharts, charts, and sequences. It aims to provide a clear and concise representation of data. PowerBI Wizard It is a popular businessintelligence tool that empowers you to explore data.
These regulations have a monumental impact on data processing and handling , consumer profiling and data security. Businesses are under intense pressure not only to comply with the requirements established but also to understand the impact on current and future operations. Basic BusinessIntelligence Experience is a Must.
Data Storytelling in Action: This panel will discuss the importance of data visualization in storytelling in different industries, different visualization tools, tips on improving one’s visualization skills, personal experiences, breakthroughs, pressures, and frustrations as well as successes and failures.
Data analytics is a task that resides under the data science umbrella and is done to query, interpret and visualize datasets. Datascientists will often perform data analysis tasks to understand a dataset or evaluate outcomes. Those who work in the field of data science are known as datascientists.
With the help of Tableau, organisations have been able to mine and gather actionable insights from granular sources of data. Tableau can help DataScientists generate graphs, charts, maps and data-driven stories, etc for purpose of visualisation and analysing data.
Microsoft PowerBI Microsoft PowerBI is almost synonymous with comprehensive businessintelligence capabilities. Like our other platform, it allows users to connect to hundreds of data sources, simplify data prep, and drive ad hoc analysis.
A typical modern data stack consists of the following: A data warehouse. Data ingestion/integration services. Data orchestration tools. Businessintelligence (BI) platforms. How Did the Modern Data Stack Get Started? Better Data Culture. Business analysts. Datascientists.
Think of Data Science as the overarching umbrella, covering a wide range of tasks performed to find patterns in large datasets, while Data Analytics is a task that resides under the Data Science umbrella to query, interpret, and visualize datasets. Skillset Required DataScientists need strong programming skills.
ML/AI Enthusiasts, and Learners Citizen DataScientists who prefer a low code solution for quick testing. Experienced DataScientists who want to try out different use-cases as per their business context for quick prototyping. Students and Teachers.
The Three Types of Data Science Data science isn’t a one-size-fits-all solution. There are three main types, each serving a distinct purpose: Descriptive Analytics (BusinessIntelligence): This focuses on understanding what happened. Building Your Data Science Team Data science talent is in high demand.
Focus on Data Science tools and businessintelligence. Focus on exploratory Data Analysis and feature engineering. Ideal starting point for aspiring DataScientists. AI and Machine Learning courses provide essential skills in Data Analysis, predictive modelling, and AI applications.
A data warehouse is a centralised repository that consolidates data from various sources for reporting and analysis. It is essential to provide a unified data view and enable businessintelligence and analytics. Industry-specific Tools and Technologies Questions Are you familiar with any data visualisation tools?
Data Science focuses on analysing data to find patterns and make predictions. Data engineering, on the other hand, builds the foundation that makes this analysis possible. Without well-structured data, DataScientists cannot perform their work efficiently.
We organize all of the trending information in your field so you don't have to. Join 17,000+ users and stay up to date on the latest articles your peers are reading.
You know about us, now we want to get to know you!
Let's personalize your content
Let's get even more personalized
We recognize your account from another site in our network, please click 'Send Email' below to continue with verifying your account and setting a password.


Let's personalize your content