This site uses cookies to improve your experience. To help us insure we adhere to various privacy regulations, please select your country/region of residence. If you do not select a country, we will assume you are from the United States. Select your Cookie Settings or view our Privacy Policy and Terms of Use.
Cookie Settings
Cookies and similar technologies are used on this website for proper function of the website, for tracking performance analytics and for marketing purposes. We and some of our third-party providers may use cookie data for various purposes. Please review the cookie settings below and choose your preference.
Used for the proper function of the website
Used for monitoring website traffic and interactions
Cookie Settings
Cookies and similar technologies are used on this website for proper function of the website, for tracking performance analytics and for marketing purposes. We and some of our third-party providers may use cookie data for various purposes. Please review the cookie settings below and choose your preference.
Strictly Necessary: Used for the proper function of the website
Performance/Analytics: Used for monitoring website traffic and interactions
Overview Analytics and BusinessIntelligence provide comprehensible view of the company and derive actionable insights. We’ll discuss 6 top businessintelligence tools that you. The post 6 Top Tools for Analytics and BusinessIntelligence in 2020 appeared first on Analytics Vidhya.
This article was published as a part of the Data Science Blogathon Introduction This article will introduce you to the Spotfire BusinessIntelligence tool for creating interactive visualization, performing data analysis, and data science. Spotfire a major player in the BI space is a product from TIBCO.
Introduction Are you a passionate data professional exploring new tools? Try Metabase, an open-source BusinessIntelligence (BI) tool for creating interactive dashboards from large datasets. Discover the power of Metabase in this guide tailored for data professionals.
Overview Tableau vs. Qlik Sense – Each Analytics and BusinessIntelligence tool has its own distinct set of features We’ll compare Tableau and Qlik. The post Tableau vs. Qlik Sense – Which Analytics and BusinessIntelligence Tool Should you Use? appeared first on Analytics Vidhya.
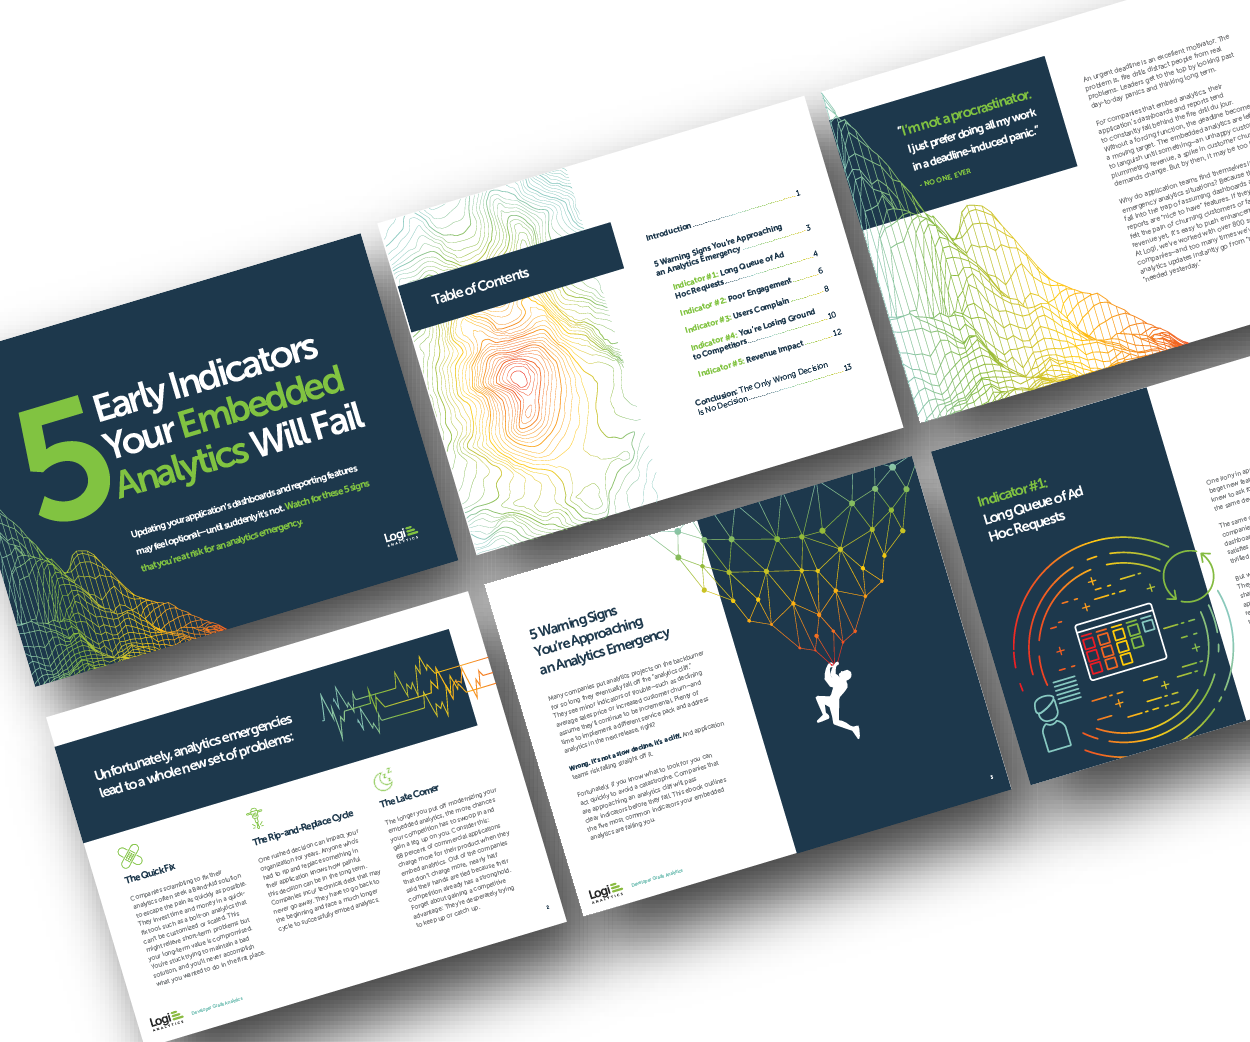
Many application teams leave embedded analytics to languish until something—an unhappy customer, plummeting revenue, a spike in customer churn—demands change. But by then, it may be too late. In this White Paper, Logi Analytics has identified 5 tell-tale signs your project is moving from “nice to have” to “needed yesterday.".
ArticleVideo Book This article was published as a part of the Data Science Blogathon. This article helps in understanding the importance of data. The post Guide to DataVisualization and Insights appeared first on Analytics Vidhya.
ArticleVideo Book This article was published as a part of the Data Science Blogathon. Introduction Datavisualization is the practice of translating data into. The post Top 10 DataVisualization Tools appeared first on Analytics Vidhya.
Overview Animated visualizations are a work of art and are really easy to create in Tableau We’ll work with open-source datasets here and create. The post Build your own Animated DataVisualization in Tableau in Just 5 Minutes appeared first on Analytics Vidhya.
Introduction Tableau has emerged as a popular datavisualization tool in companies, making it one of the hottest trends in BusinessIntelligence. In India, people are curious about the Tableau developer salary statistics.
Think your customers will pay more for datavisualizations in your application? But today, dashboards and visualizations have become table stakes. Five years ago they may have. Discover which features will differentiate your application and maximize the ROI of your embedded analytics. Brought to you by Logi Analytics.
Data-driven businesses are five times more likely to make faster decisions than their market peers, and twice as likely to land in the top quartile of financial performance within their industries. The post 6 Ways BusinessIntelligence is Going to Change in 2017 appeared first on Dataconomy.
Summary: Big Datavisualization involves representing large datasets graphically to reveal patterns, trends, and insights that are not easily discernible from raw data. quintillion bytes of data daily, the need for effective visualization techniques has never been greater. As we generate approximately 2.5
This article was published as a part of the Data Science Blogathon. Introduction Tableau is a datavisualization tool created in Salesforce that allows users to connect to any database, like SQL or MongoDB, and interact freely. The post Most Frequently Asked Tableau Interview Questions appeared first on Analytics Vidhya.
What’s the best BusinessIntelligence and Analytics tool in the market? A plethora of data science and businessintelligence professionals and organizations have asked. The post Gartner’s 2020 Magic Quadrant is Out!
South Dakota State University is seeking a DataVisualization Developer and Analyst in Brookings, SD, to create businessintelligence tools and reports to support the use of a campus-wide businessintelligence and decision support system, compile multiple visualizations into intuitive dashboards for campus-wide use, and more.
While different companies, regardless of their size, have different operational processes, they share a common need for actionable insight to drive success in their business. Advancement in big data technology has made the world of business even more competitive. This eliminates guesswork when coming up with business strategies.
Data Analyst Data analysts are responsible for collecting, analyzing, and interpreting large sets of data to identify patterns and trends. They require strong analytical skills, knowledge of statistical analysis, and expertise in datavisualization.
There are a lot of different ways that big data can help companies streamline certain processes and resolve various challenges that they face. The advent of datavisualization has made it easier than ever. It just one of the many ways that data analytics is helping optimize organizational processes.
Summary : Prepare for your datavisualization interview with our guide to the top questions and answers. Introduction Datavisualization is no longer just a niche skill; it’s a fundamental component of Data Analysis , businessintelligence, and data science.
The issue is many organizations have segregated data environments. Each department often has its own data management platform that may not integrate with other […] The post Data Concierge: Driving BusinessIntelligence Collaboration appeared first on DATAVERSITY.
If the work of a human’s mind can be somehow represented, interactive datavisualization is the closest form of such representation right before pure art. So, what is Interactive datavisualization and how are they driven by modern interactive datavisualization tools? Want to learn more about GoJS?
One of the biggest advantages is that big data helps companies utilize businessintelligence. It is one of the biggest reasons that the market for big data is projected to be worth $273 billion by 2026. Companies are finding more creative ways to employ data analytics to improve their businessintelligence strategies.
This article was published as a part of the Data Science Blogathon. PowerBI is used for Businessintelligence. What is equally important here is the ability to communicate the data and insights from your predictive models through reports and dashboards. And […].
This article was published as a part of the Data Science Blogathon. This self-service businessintelligence tool is the latest and greatest in the data-driven industry. It eased the workaround for attaining data from several sources and consolidating it into one management […].
BI (BusinessIntelligence) systems exist to solve problems. This is a long and actively developing class of applications, which allow to take all business-relevant parameters and build analytical reports on them independently, instantly, and in any context. When businessintelligence is needed? Conclusion.
It is important to learn the best businessintelligence trends for 2022 because data went viral and became enormous. Spreadsheets have given way to actionable and informative datavisualizations and interactive business dashboards. And just like that, we all gained access to the cloud.
Companies use BusinessIntelligence (BI), Data Science , and Process Mining to leverage data for better decision-making, improve operational efficiency, and gain a competitive edge. A Data Product can take various forms, depending on the domain’s requirements and the data it manages.
Open source businessintelligence software is a game-changer in the world of data analysis and decision-making. It has revolutionized the way businesses approach data analytics by providing cost-effective and customizable solutions that are tailored to specific business needs.
Data engineering tools offer a range of features and functionalities, including data integration, data transformation, data quality management, workflow orchestration, and datavisualization. Essential data engineering tools for 2023 Top 10 data engineering tools to watch out for in 2023 1.
Businessintelligence (BI) tools transform the unprocessed data into meaningful and actionable insight. BI tools analyze the data and convert them […]. The post Important Features of Top BusinessIntelligence Tools appeared first on DATAVERSITY.
ArticleVideo Book This article was published as a part of the Data Science Blogathon. Introduction DataVisualization is a graphical way to represent data by. The post Make Your Tableau Visuals More Effective – Tips And Tricks appeared first on Analytics Vidhya.
Summary: BusinessIntelligence tools are software applications that help organizations collect, process, analyse, and visualizedata from various sources. Introduction BusinessIntelligence (BI) tools are essential for organizations looking to harness data effectively and make informed decisions.
Summary: BusinessIntelligence Analysts transform raw data into actionable insights. They use tools and techniques to analyse data, create reports, and support strategic decisions. Key skills include SQL, datavisualization, and business acumen. Introduction We are living in an era defined by data.
This week, Gartner published the 2021 Magic Quadrant for Analytics and BusinessIntelligence Platforms. I first want to thank you, the Tableau Community, for your continued support and your commitment to data, to Tableau, and to each other. Francois Ajenstat. Kristin Adderson. January 27, 2021 - 4:36pm. February 18, 2021.
Graphs, charts with colors, lines and shapes can often tell a story and communicate issues, challenges and opportunities in a business environment. According to Forbes, Almost eighty-thousand scientific studies attest that visual images promote retention.
Summary: Understanding BusinessIntelligence Architecture is essential for organizations seeking to harness data effectively. This framework includes components like data sources, integration, storage, analysis, visualization, and information delivery. What is BusinessIntelligence Architecture?
In today’s fast-paced business landscape, companies need to stay ahead of the curve to remain competitive. Businessintelligence (BI) has emerged as a key solution to help companies gain insights into their operations and market trends. What is businessintelligence?
In today’s fast-paced business landscape, companies need to stay ahead of the curve to remain competitive. Businessintelligence (BI) has emerged as a key solution to help companies gain insights into their operations and market trends. What is businessintelligence?
Data Analyst Data Analyst is a featured GPT in the store that specializes in data analysis and visualization. You can upload your data files to this GPT that it can then analyze. Other than the advanced data analysis, it can also deal with image conversions. It is capable of writing and running Python codes.
This blog delves into the transformative role of DataVisualization, decoding its various forms, from bar charts to radar charts. It emphasizes how effective visualization enhances comprehension, empowers decision-makers, and fosters a data-driven culture. Useful for understanding the spread and skewness of data.
Business reporting has been around for a long time but the tools and techniques of businessintelligence have refined over time and now with the recent popularity of data driven business approach, data has been identified as the most valuable asset of a business and data analytics and reporting has finally found a key place in the business world.
In the fast-paced world, businesses must be on their toes to make their brand carve a niche. Hence, the emphasis on newer technologies like BusinessIntelligence is rising. The BusinessIntelligence decision-making is underpinning the business operations. What is BusinessIntelligence?
Typical businessintelligence implementations allow business users to easily consume data specific to their goals and daily tasks. The ability to analyze both past and present events unlocks information about the current state and is essential for remaining competitive in today’s data-forward market.
In the digital era, datavisualization stands as an indispensable tool in the realm of businessintelligence. It represents the graphical display of data and information, transforming complex datasets into intuitive and understandable visuals.
We organize all of the trending information in your field so you don't have to. Join 17,000+ users and stay up to date on the latest articles your peers are reading.
You know about us, now we want to get to know you!
Let's personalize your content
Let's get even more personalized
We recognize your account from another site in our network, please click 'Send Email' below to continue with verifying your account and setting a password.


Let's personalize your content