This site uses cookies to improve your experience. To help us insure we adhere to various privacy regulations, please select your country/region of residence. If you do not select a country, we will assume you are from the United States. Select your Cookie Settings or view our Privacy Policy and Terms of Use.
Cookie Settings
Cookies and similar technologies are used on this website for proper function of the website, for tracking performance analytics and for marketing purposes. We and some of our third-party providers may use cookie data for various purposes. Please review the cookie settings below and choose your preference.
Used for the proper function of the website
Used for monitoring website traffic and interactions
Cookie Settings
Cookies and similar technologies are used on this website for proper function of the website, for tracking performance analytics and for marketing purposes. We and some of our third-party providers may use cookie data for various purposes. Please review the cookie settings below and choose your preference.
Strictly Necessary: Used for the proper function of the website
Performance/Analytics: Used for monitoring website traffic and interactions
Introduction Are you a passionate data professional exploring new tools? Try Metabase, an open-source BusinessIntelligence (BI) tool for creating interactive dashboards from large datasets. Discover the power of Metabase in this guide tailored for data professionals.
This article was published as a part of the Data Science Blogathon. Introduction Tableau is a datavisualization tool created in Salesforce that allows users to connect to any database, like SQL or MongoDB, and interact freely.
Data Analyst Data analysts are responsible for collecting, analyzing, and interpreting large sets of data to identify patterns and trends. They require strong analytical skills, knowledge of statistical analysis, and expertise in datavisualization.
Introduction This article will introduce the concept of data modeling, a crucial process that outlines how data is stored, organized, and accessed within a database or data system. It involves converting real-world business needs into a logical and structured format that can be realized in a database or data warehouse.
Think your customers will pay more for datavisualizations in your application? But today, dashboards and visualizations have become table stakes. Five years ago they may have. Discover which features will differentiate your application and maximize the ROI of your embedded analytics. Brought to you by Logi Analytics.
Summary: Big Datavisualization involves representing large datasets graphically to reveal patterns, trends, and insights that are not easily discernible from raw data. quintillion bytes of data daily, the need for effective visualization techniques has never been greater. As we generate approximately 2.5
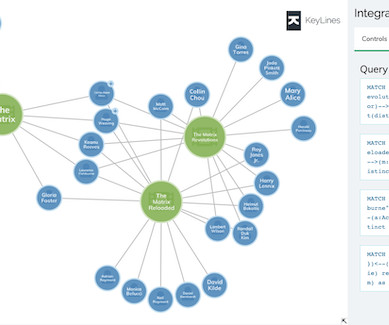
If the work of a human’s mind can be somehow represented, interactive datavisualization is the closest form of such representation right before pure art. So, what is Interactive datavisualization and how are they driven by modern interactive datavisualization tools? Want to learn more about GoJS?
ArticleVideo Book This article was published as a part of the Data Science Blogathon. The post Learn how to get insights from Azure SQL Database: A sample data analytics project using Global Peace Index data appeared first on Analytics Vidhya. Introduction Are you passionate about the empirical investigation to find.
Open source businessintelligence software is a game-changer in the world of data analysis and decision-making. It has revolutionized the way businesses approach data analytics by providing cost-effective and customizable solutions that are tailored to specific business needs.
Data Analyst Data Analyst is a featured GPT in the store that specializes in data analysis and visualization. You can upload your data files to this GPT that it can then analyze. Other than the advanced data analysis, it can also deal with image conversions.
Summary: BusinessIntelligence Analysts transform raw data into actionable insights. They use tools and techniques to analyse data, create reports, and support strategic decisions. Key skills include SQL, datavisualization, and business acumen. Introduction We are living in an era defined by data.
This week, Gartner published the 2021 Magic Quadrant for Analytics and BusinessIntelligence Platforms. I first want to thank you, the Tableau Community, for your continued support and your commitment to data, to Tableau, and to each other. Francois Ajenstat. Kristin Adderson. January 27, 2021 - 4:36pm. February 18, 2021.
Summary: BusinessIntelligence tools are software applications that help organizations collect, process, analyse, and visualizedata from various sources. Introduction BusinessIntelligence (BI) tools are essential for organizations looking to harness data effectively and make informed decisions.
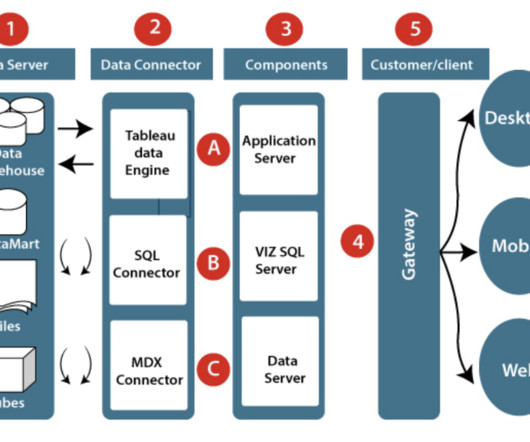
Summary: Understanding BusinessIntelligence Architecture is essential for organizations seeking to harness data effectively. This framework includes components like data sources, integration, storage, analysis, visualization, and information delivery. What is BusinessIntelligence Architecture?
In today’s fast-paced business landscape, companies need to stay ahead of the curve to remain competitive. Businessintelligence (BI) has emerged as a key solution to help companies gain insights into their operations and market trends. What is businessintelligence?
In today’s fast-paced business landscape, companies need to stay ahead of the curve to remain competitive. Businessintelligence (BI) has emerged as a key solution to help companies gain insights into their operations and market trends. What is businessintelligence?
There are many well-known libraries and platforms for data analysis such as Pandas and Tableau, in addition to analytical databases like ClickHouse, MariaDB, Apache Druid, Apache Pinot, Google BigQuery, Amazon RedShift, etc. Datavisualization can help here by visualizing your datasets.
Summary: Data Analysis focuses on extracting meaningful insights from raw data using statistical and analytical methods, while datavisualization transforms these insights into visual formats like graphs and charts for better comprehension. Deep Dive: What is DataVisualization?
Data mining is a fascinating field that blends statistical techniques, machine learning, and database systems to reveal insights hidden within vast amounts of data. Businesses across various sectors are leveraging data mining to gain a competitive edge, improve decision-making, and optimize operations.
There’s not much value in holding on to raw data without putting it to good use, yet as the cost of storage continues to decrease, organizations find it useful to collect raw data for additional processing. The raw data can be fed into a database or data warehouse. If it’s not done right away, then later.
Experts from the field gathered to discuss and deliberate on various topics related to data and AI, sharing their insights with the attendees. Introduction to Python for Data Science: This lecture introduces the tools and libraries used in Python for data science and engineering. Want to dive deep into Python?
Data Analyst Data Analyst is a featured GPT in the store that specializes in data analysis and visualization. You can upload your data files to this GPT that it can then analyze. Other than the advanced data analysis, it can also deal with image conversions.
You might be asking, “How to become a data scientist with a background in a different field?” ” Data management and manipulation Data scientists often deal with vast amounts of data, so it’s crucial to understand databases, data architecture, and query languages like SQL.
Data Analyst Data Analyst is a featured GPT in the store that specializes in data analysis and visualization. You can upload your data files to this GPT that it can then analyze. Other than the advanced data analysis, it can also deal with image conversions.
Data models help visualize and organize data, processing applications handle large datasets efficiently, and analytics models aid in understanding complex data sets, laying the foundation for businessintelligence. It helps organizations understand trends, patterns, and anomalies in their data.
That’s why our datavisualization SDKs are database agnostic: so you’re free to choose the right stack for your application. There have been a lot of new entrants and innovations in the graph database category, with some vendors slowly dipping below the radar, or always staying on the periphery.
The project I did to land my businessintelligence internship — CAR BRAND SEARCH ETL PROCESS WITH PYTHON, POSTGRESQL & POWER BI 1. It is a data integration process that involves extracting data from various sources, transforming it into a consistent format, and loading it into a target system. Windows NT 10.0;
This week, Gartner published the 2021 Magic Quadrant for Analytics and BusinessIntelligence Platforms. I first want to thank you, the Tableau Community, for your continued support and your commitment to data, to Tableau, and to each other. Francois Ajenstat. Kristin Adderson. January 27, 2021 - 4:36pm. February 18, 2021.
What is BusinessIntelligence? BusinessIntelligence (BI) refers to the technology, techniques, and practises that are used to gather, evaluate, and present information about an organisation in order to assist decision-making and generate effective administrative action. billion in 2015 and reached around $26.50
Build a Data Analyst AI Agent fromScratch Daniel Herrera, Principal Developer Advocate atTeradata Daniel Herrera guided attendees through the process of building a data analyst AI agent from the ground up. He covered schema design, vector indexing, and ranking functions to optimize AI-driven search and recommendation systems.
Common databases appear unable to cope with the immense increase in data volumes. This is where the BigQuery data warehouse comes into play. BigQuery operation principles Businessintelligence projects presume collecting information from different sources into one database.
It can connect any data source, although the better your source, the better the results will be. Another key benefit is that it allows companies to create datavisualizations! Splunk is super secure as well, which is a huge concern for today’s businesses. It works with a number of different databases. RapidMiner.
Data analytics is a task that resides under the data science umbrella and is done to query, interpret and visualize datasets. Data scientists will often perform data analysis tasks to understand a dataset or evaluate outcomes.
It is popular for its powerful datavisualization and analysis capabilities. Hence, Data Scientists rely on R to perform complex statistical operations. With a wide array of packages like ggplot2 and dplyr, R allows for sophisticated datavisualization and efficient data manipulation.
They are being increasingly challenged to improve efficiency and cost savings, embrace automation, and engage in data-driven decision making that helps their organization stand out from the competition. A business event can describe anything that happens which is significant to an enterprise’s operation.
There’s a multitude of different reasons why an organization may consider a businessintelligence (BI) platform migration. On-Premises to The Cloud This type of migration involves moving an organization’s BI platform from an on-premises environment (such as a local server or data center) to a cloud-based environment.
Modernizing your data infrastructure to hybrid cloud for applications, analytics and gen AI Adopting multicloud and hybrid strategies is becoming mandatory, requiring databases that support flexible deployments across the hybrid cloud. This ensures you have a data foundation that grows with your data needs, wherever your data resides.
Before understanding this data storage, let us know a bit about Tableau. Tableau is one of the most popular datavisualization and businessintelligence tools that help people see and understand their data. A Tableau data source may contain multiple data connections to different databases or files.
Before understanding this data storage, let us know a bit about Tableau. Tableau is one of the most popular datavisualization and businessintelligence tools that help people see and understand their data. A Tableau data source may contain multiple data connections to different databases or files.
It combines techniques from mathematics, statistics, computer science, and domain expertise to analyze data, draw conclusions, and forecast future trends. Data scientists use a combination of programming languages (Python, R, etc.), This diversity allows individuals to find a niche that aligns with their passions and expertise.
Significantly, Data Science experts have a strong foundation in mathematics, statistics, and computer science. Furthermore, they must be highly efficient in programming languages like Python or R and have datavisualization tools and database expertise. Who is a Data Analyst?
How to Optimize Power BI and Snowflake for Advanced Analytics Spencer Baucke May 25, 2023 The world of businessintelligence and data modernization has never been more competitive than it is today. Microsoft Power BI has been the leader in the analytics and businessintelligence platforms category for several years running.
Descriptive Analytics Descriptive analytics focuses on summarizing historical data to gain a better understanding of past events and trends. ” This type of analytics uses various techniques, such as data aggregation, datavisualization , and statistical analysis to provide a comprehensive overview of business performance.
Key Features of Power BI: Power BI is a powerful businessintelligence tool developed by Microsoft that enables users to visualize and analyze data from various sources. It offers a wide range of features that make it a popular choice for data professionals, analysts, and organizations.
We organize all of the trending information in your field so you don't have to. Join 17,000+ users and stay up to date on the latest articles your peers are reading.
You know about us, now we want to get to know you!
Let's personalize your content
Let's get even more personalized
We recognize your account from another site in our network, please click 'Send Email' below to continue with verifying your account and setting a password.


Let's personalize your content