This site uses cookies to improve your experience. To help us insure we adhere to various privacy regulations, please select your country/region of residence. If you do not select a country, we will assume you are from the United States. Select your Cookie Settings or view our Privacy Policy and Terms of Use.
Cookie Settings
Cookies and similar technologies are used on this website for proper function of the website, for tracking performance analytics and for marketing purposes. We and some of our third-party providers may use cookie data for various purposes. Please review the cookie settings below and choose your preference.
Used for the proper function of the website
Used for monitoring website traffic and interactions
Cookie Settings
Cookies and similar technologies are used on this website for proper function of the website, for tracking performance analytics and for marketing purposes. We and some of our third-party providers may use cookie data for various purposes. Please review the cookie settings below and choose your preference.
Strictly Necessary: Used for the proper function of the website
Performance/Analytics: Used for monitoring website traffic and interactions
Introduction Microsoft’s PowerBI is one of its rapidly growing corporate analytics services. This self-service businessintelligence tool is the latest and greatest in the data-driven industry. It eased the workaround for attaining data from several sources and consolidating it into one management […].
PowerBI is used for Businessintelligence. What is equally important here is the ability to communicate the data and insights from your predictive models through reports and dashboards. The post Building your First PowerBI Report from Scratch appeared first on Analytics Vidhya. And […].
Overview Analytics and BusinessIntelligence provide comprehensible view of the company and derive actionable insights. We’ll discuss 6 top businessintelligence tools that you. The post 6 Top Tools for Analytics and BusinessIntelligence in 2020 appeared first on Analytics Vidhya.
ArticleVideo Book This article was published as a part of the Data Science Blogathon. Microsoft PowerBI is a collection of apps, software services, The post Rise of Microsoft PowerBI as a Data Analytics powerhouse appeared first on Analytics Vidhya.
ArticleVideo Book This article was published as a part of the Data Science Blogathon. This article helps in understanding the importance of data. The post Guide to DataVisualization and Insights appeared first on Analytics Vidhya.
Summary: Big Datavisualization involves representing large datasets graphically to reveal patterns, trends, and insights that are not easily discernible from raw data. quintillion bytes of data daily, the need for effective visualization techniques has never been greater. As we generate approximately 2.5
Businessintelligence is a crucial component in the chase to be on the top in this competitive corporate sphere. As a venture grows, it becomes tedious to keep track of the analytical data of the enterprise which, in turn, forms a road-block to decision making. Its in-memory analysis and DAX technology offer balanced simplicity.
Open source businessintelligence software is a game-changer in the world of data analysis and decision-making. It has revolutionized the way businesses approach data analytics by providing cost-effective and customizable solutions that are tailored to specific business needs.
How to Optimize PowerBI and Snowflake for Advanced Analytics Spencer Baucke May 25, 2023 The world of businessintelligence and data modernization has never been more competitive than it is today. Table of Contents Why Discuss Snowflake & PowerBI?
In the sales context, this helps monitor sales data in PowerBI reports and trigger alerts or actions based on real-time changes, ensuring that sales teams can respond quickly to critical events. This opens another tab of PowerBI , where you can visualize the sales data and create interactive dashboards.
Summary: BusinessIntelligence Analysts transform raw data into actionable insights. They use tools and techniques to analyse data, create reports, and support strategic decisions. Key skills include SQL, datavisualization, and business acumen. Introduction We are living in an era defined by data.
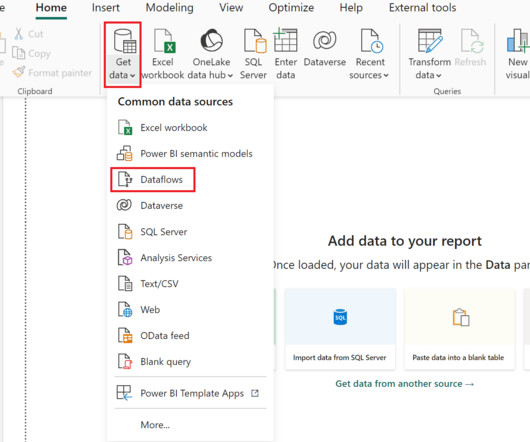
We at phData have written extensively about creating centralized data products in PowerBI. However, we have not yet touched on dataflows and the importance of this unique type of data product. Most PowerBI developers are familiar with Power Query , Which is the data transformation layer of PowerBI.
Summary: BusinessIntelligence tools are software applications that help organizations collect, process, analyse, and visualizedata from various sources. Introduction BusinessIntelligence (BI) tools are essential for organizations looking to harness data effectively and make informed decisions.
Driving a data culture is now a lot more — well, driven — thanks to the latest of Alation’s 80+ connectors : PowerBI Scanner, which unifies self-service and enterprise analytics and allows users to find answers fast with industry-leading AI. What Is the Significance of the Alation & PowerBI Partnership?
PowerBI Heatmap: Heatmap in PowerBI refers to the type of custom visualisation that businesses analysts utilise for showcasing the relationship between two variables on a map in different colour patches. It helps the user in visualising the patterns which are hidden and observe the changes across each axis.
Consequently, the tools we employ to process and visualize this data play a critical role. Among these tools, KNIME and PowerBI have emerged as key players, catering to the demands of this evolving landscape. In this blog, we will focus on integrating PowerBI within KNIME for enhanced data analytics.
Data Analyst Data Analyst is a featured GPT in the store that specializes in data analysis and visualization. You can upload your data files to this GPT that it can then analyze. Other than the advanced data analysis, it can also deal with image conversions. It is capable of writing and running Python codes.
At this point, PowerBI has extended itself beyond the definition of just a datavisualization tool and truly is a robust businessintelligence platform. And I’m not talking about the PowerBI mobile application. And I’m not talking about the PowerBI mobile application.
In the digital era, datavisualization stands as an indispensable tool in the realm of businessintelligence. It represents the graphical display of data and information, transforming complex datasets into intuitive and understandable visuals.
In today’s fast-paced business landscape, companies need to stay ahead of the curve to remain competitive. Businessintelligence (BI) has emerged as a key solution to help companies gain insights into their operations and market trends. What is businessintelligence?
In today’s fast-paced business landscape, companies need to stay ahead of the curve to remain competitive. Businessintelligence (BI) has emerged as a key solution to help companies gain insights into their operations and market trends. What is businessintelligence?
Summary: Understanding BusinessIntelligence Architecture is essential for organizations seeking to harness data effectively. This framework includes components like data sources, integration, storage, analysis, visualization, and information delivery. What is BusinessIntelligence Architecture?
In the world of datavisualization , the ability to produce material that can speak to your audience, regardless of their technical expertise, is an ever-important factor to consider. Tableau Public Tableau Public , a powerfuldatavisualization software, empowers users to create interactive and shareable dashboards with ease.
Data Storytelling in Action: This panel will discuss the importance of datavisualization in storytelling in different industries, different visualization tools, tips on improving one’s visualization skills, personal experiences, breakthroughs, pressures, and frustrations as well as successes and failures.
Even if you don’t have a degree, you might still be pondering, “How to become a data scientist?” ” Datavisualization and communication It’s not enough to uncover insights from data; a data scientist must also communicate these insights effectively. Works with smaller data sets.
Data Analyst Data Analyst is a featured GPT in the store that specializes in data analysis and visualization. You can upload your data files to this GPT that it can then analyze. Other than the advanced data analysis, it can also deal with image conversions. It is capable of writing and running Python codes.
Data Analyst Data Analyst is a featured GPT in the store that specializes in data analysis and visualization. You can upload your data files to this GPT that it can then analyze. Other than the advanced data analysis, it can also deal with image conversions. It is capable of writing and running Python codes.
The project I did to land my businessintelligence internship — CAR BRAND SEARCH ETL PROCESS WITH PYTHON, POSTGRESQL & POWERBI 1. Load Data After the transform process we will load that “final dataframe” into pgadmin4 , pgAdmin is an open-source administration and development platform for PostgreSQL.
Summary: Conditional formatting in PowerBI transforms data visualisation by dynamically adjusting visual elements based on data values. Introduction Microsoft PowerBI has a 15.62% market share in data visualisation, making it a leading tool for transforming data into actionable insights.
What is BusinessIntelligence? BusinessIntelligence (BI) refers to the technology, techniques, and practises that are used to gather, evaluate, and present information about an organisation in order to assist decision-making and generate effective administrative action. What Does a BI Developer Do?
These tools provide scalability and ease of use, making them ideal for enterprises that require robust data processing capabilities. DataVisualization and BusinessIntelligence Tableau Tableau has revolutionized datavisualization, offering a user-friendly platform for creating interactive dashboards and reports.
Data analytics is a task that resides under the data science umbrella and is done to query, interpret and visualize datasets. Data scientists will often perform data analysis tasks to understand a dataset or evaluate outcomes.
Tableau further has its own drawbacks in case of its use in Data Science considering it is a Data Analysis tool rather than a tool for Data Science. How Professionals Can Use Tableau for Data Science? Collaboration and sharing: Tableau provides features for collaboration and sharing of datavisualizations and dashboards.
A typical modern data stack consists of the following: A data warehouse. Data ingestion/integration services. Data orchestration tools. Businessintelligence (BI) platforms. How Did the Modern Data Stack Get Started? An example of a data science tool is Dataiku. Reverse ETL tools.
This comprehensive blog outlines vital aspects of Data Analyst interviews, offering insights into technical, behavioural, and industry-specific questions. It covers essential topics such as SQL queries, datavisualization, statistical analysis, machine learning concepts, and data manipulation techniques.
While Excel is not as powerful as specialized data manipulation tools, it is widely accessible and user-friendly. BusinessIntelligence (BI) Tools BI tools like Tableau, PowerBI, and QlikView provide comprehensive data manipulation features and advanced visualization capabilities.
Click to learn more about author Piyush Goel. The health care system today is in the midst of a much-needed technological revolution. Considering how medical errors are now the number three killer in the United States every year, this overhaul is sorely needed. Furthermore, COVID-19 stretched the health care system thin over the past 16 months.
Companies use BusinessIntelligence (BI), Data Science , and Process Mining to leverage data for better decision-making, improve operational efficiency, and gain a competitive edge. A Data Product can take various forms, depending on the domain’s requirements and the data it manages.
Summary: This blog dives into the most promising PowerBI projects, exploring advanced datavisualization, AI integration, IoT & blockchain analytics, and emerging technologies. Discover best practices for successful implementation and propel your organization towards data-driven success.
Introduction In the rapidly evolving landscape of data analytics, BusinessIntelligence (BI) tools have become indispensable for organizations seeking to leverage their big data stores for strategic decision-making. There is a plethora of BI tools available in the market today, with new ones being added yearly.
The Three Types of Data Science Data science isn’t a one-size-fits-all solution. There are three main types, each serving a distinct purpose: Descriptive Analytics (BusinessIntelligence): This focuses on understanding what happened. Hadoop/Spark: Frameworks for distributed storage and processing of big data.
Basic tools Using Excel allows for straightforward analyses and quick datavisualizations. Businessintelligence tools Advanced applications such as PowerBI and Tableau provide sophisticated datavisualization and reporting capabilities.
It helps data engineers collect, store, and process streams of records in a fault-tolerant way, making it crucial for building reliable data pipelines. Amazon Redshift Amazon Redshift is a cloud-based data warehouse that enables fast query execution for large datasets.
We organize all of the trending information in your field so you don't have to. Join 17,000+ users and stay up to date on the latest articles your peers are reading.
You know about us, now we want to get to know you!
Let's personalize your content
Let's get even more personalized
We recognize your account from another site in our network, please click 'Send Email' below to continue with verifying your account and setting a password.


Let's personalize your content