This site uses cookies to improve your experience. To help us insure we adhere to various privacy regulations, please select your country/region of residence. If you do not select a country, we will assume you are from the United States. Select your Cookie Settings or view our Privacy Policy and Terms of Use.
Cookie Settings
Cookies and similar technologies are used on this website for proper function of the website, for tracking performance analytics and for marketing purposes. We and some of our third-party providers may use cookie data for various purposes. Please review the cookie settings below and choose your preference.
Used for the proper function of the website
Used for monitoring website traffic and interactions
Cookie Settings
Cookies and similar technologies are used on this website for proper function of the website, for tracking performance analytics and for marketing purposes. We and some of our third-party providers may use cookie data for various purposes. Please review the cookie settings below and choose your preference.
Strictly Necessary: Used for the proper function of the website
Performance/Analytics: Used for monitoring website traffic and interactions
Overview Tableau vs. Qlik Sense – Each Analytics and BusinessIntelligence tool has its own distinct set of features We’ll compare Tableau and Qlik. The post Tableau vs. Qlik Sense – Which Analytics and BusinessIntelligence Tool Should you Use? appeared first on Analytics Vidhya.
Introduction Tableau has emerged as a popular datavisualization tool in companies, making it one of the hottest trends in BusinessIntelligence. In India, people are curious about the Tableau developer salary statistics. We will […] The post What is the Tableau Developer Salary in India?
Overview Animated visualizations are a work of art and are really easy to create in Tableau We’ll work with open-source datasets here and create. The post Build your own Animated DataVisualization in Tableau in Just 5 Minutes appeared first on Analytics Vidhya.
Overview Analytics and BusinessIntelligence provide comprehensible view of the company and derive actionable insights. We’ll discuss 6 top businessintelligence tools that you. The post 6 Top Tools for Analytics and BusinessIntelligence in 2020 appeared first on Analytics Vidhya.
Think your customers will pay more for datavisualizations in your application? But today, dashboards and visualizations have become table stakes. Five years ago they may have. Discover which features will differentiate your application and maximize the ROI of your embedded analytics. Brought to you by Logi Analytics.
This article was published as a part of the Data Science Blogathon. Introduction Tableau is a datavisualization tool created in Salesforce that allows users to connect to any database, like SQL or MongoDB, and interact freely.
This article was published as a part of the Data Science Blogathon. Introduction to Tableau Tips! Creating a chart or visual in Tableau is. The post 5 Tableau Tips for Designing a Tidy and Impactful Visualization appeared first on Analytics Vidhya.
ArticleVideo Book This article was published as a part of the Data Science Blogathon. Introduction Datavisualization is the practice of translating data into. The post Top 10 DataVisualization Tools appeared first on Analytics Vidhya.
ArticleVideo Book This article was published as a part of the Data Science Blogathon. Introduction DataVisualization is a graphical way to represent data by. The post Make Your TableauVisuals More Effective – Tips And Tricks appeared first on Analytics Vidhya.
Summary: Big Datavisualization involves representing large datasets graphically to reveal patterns, trends, and insights that are not easily discernible from raw data. quintillion bytes of data daily, the need for effective visualization techniques has never been greater. As we generate approximately 2.5
While different companies, regardless of their size, have different operational processes, they share a common need for actionable insight to drive success in their business. Advancement in big data technology has made the world of business even more competitive. This eliminates guesswork when coming up with business strategies.
What’s the best BusinessIntelligence and Analytics tool in the market? A plethora of data science and businessintelligence professionals and organizations have asked. The post Gartner’s 2020 Magic Quadrant is Out!
Summary : Prepare for your datavisualization interview with our guide to the top questions and answers. Introduction Datavisualization is no longer just a niche skill; it’s a fundamental component of Data Analysis , businessintelligence, and data science.
This week, Gartner published the 2021 Magic Quadrant for Analytics and BusinessIntelligence Platforms. Gartner has again recognized Tableau as a Leader—for our ninth consecutive year. . I first want to thank you, the Tableau Community, for your continued support and your commitment to data, to Tableau, and to each other.
Ateken Abla March 19, 2024 - 9:05pm Larissa Amoroso Vice President, Tableau Community, Tableau When Karolina Grodzinska took the stage at Tableau Conference as part of her Iron Viz: Student Edition award, it felt like the culmination of her data learning, which started in 2021. How did Karolina discover Tableau? “It
Technical Fellow, Tableau. Innovation is necessary to use data effectively in the pursuit of a better world, particularly because data continues to increase in size and richness. I am proud to announce that my History of Tableau Innovation viz is now published to Tableau Public. Jock Mackinlay. Bronwen Boyd.
Data engineering tools offer a range of features and functionalities, including data integration, data transformation, data quality management, workflow orchestration, and datavisualization. Essential data engineering tools for 2023 Top 10 data engineering tools to watch out for in 2023 1.
Companies use BusinessIntelligence (BI), Data Science , and Process Mining to leverage data for better decision-making, improve operational efficiency, and gain a competitive edge. A Data Product can take various forms, depending on the domain’s requirements and the data it manages.
Social Media and Blog Specialist, Tableau. Tableau Ambassadors teach and share while fostering a positive and supportive space within the data community. Tableau Ambassadors serve one-year terms in one of seven branches: Forums, User Groups, Student, DataDev, Public, Social, and CRM Analytics. Bronwen Boyd. Britt Staniar.
Guest author, Tableau DataDev Ambassador. Tableau is an innovator in the field of datavisualization with its ease of use, stunning visualizations, vibrant community, and more contributing to success. Visualization is, and I expect will always be, important to understand and help democratize data.
Open source businessintelligence software is a game-changer in the world of data analysis and decision-making. It has revolutionized the way businesses approach data analytics by providing cost-effective and customizable solutions that are tailored to specific business needs.
Guest author, Tableau DataDev Ambassador. Tableau is an innovator in the field of datavisualization with its ease of use, stunning visualizations, vibrant community, and more contributing to success. Visualization is, and I expect will always be, important to understand and help democratize data.
Gandes Goldestan BusinessIntelligence Analyst Jabar Digital Service Sarah Molina January 24, 2023 - 8:29pm January 25, 2023 Tableau plays a huge role in helping users get to insights quickly while telling impactful stories using their data. All visualizations were published on Tableau Public.
Senior Vice President, Product Marketing, Tableau. Every company today is being asked to do more with less, and leaders need access to fresh, trusted KPIs and data-driven insights to manage their businesses, keep ahead of the competition, and provide unparalleled customer experiences. . Allison (Ally) Witherspoon Johnston.
Senior Vice President, Product Marketing, Tableau. Every company today is being asked to do more with less, and leaders need access to fresh, trusted KPIs and data-driven insights to manage their businesses, keep ahead of the competition, and provide unparalleled customer experiences. . Allison (Ally) Witherspoon Johnston.
Technical Fellow, Tableau. Innovation is necessary to use data effectively in the pursuit of a better world, particularly because data continues to increase in size and richness. I am proud to announce that my History of Tableau Innovation viz is now published to Tableau Public. Jock Mackinlay. Bronwen Boyd.
Gandes Goldestan BusinessIntelligence Analyst Jabar Digital Service Sarah Molina January 24, 2023 - 8:29pm January 25, 2023 Tableau plays a huge role in helping users get to insights quickly while telling impactful stories using their data. All visualizations were published on Tableau Public.
Summary: BusinessIntelligence Analysts transform raw data into actionable insights. They use tools and techniques to analyse data, create reports, and support strategic decisions. Key skills include SQL, datavisualization, and business acumen. Introduction We are living in an era defined by data.
Summary: BusinessIntelligence tools are software applications that help organizations collect, process, analyse, and visualizedata from various sources. Introduction BusinessIntelligence (BI) tools are essential for organizations looking to harness data effectively and make informed decisions.
This week, Gartner published the 2021 Magic Quadrant for Analytics and BusinessIntelligence Platforms. Gartner has again recognized Tableau as a Leader—for our ninth consecutive year. . I first want to thank you, the Tableau Community, for your continued support and your commitment to data, to Tableau, and to each other.
Business reporting has been around for a long time but the tools and techniques of businessintelligence have refined over time and now with the recent popularity of data driven business approach, data has been identified as the most valuable asset of a business and data analytics and reporting has finally found a key place in the business world.
In today’s fast-paced business landscape, companies need to stay ahead of the curve to remain competitive. Businessintelligence (BI) has emerged as a key solution to help companies gain insights into their operations and market trends. What is businessintelligence?
In today’s fast-paced business landscape, companies need to stay ahead of the curve to remain competitive. Businessintelligence (BI) has emerged as a key solution to help companies gain insights into their operations and market trends. What is businessintelligence?
Summary: Understanding BusinessIntelligence Architecture is essential for organizations seeking to harness data effectively. This framework includes components like data sources, integration, storage, analysis, visualization, and information delivery. What is BusinessIntelligence Architecture?
Social Media and Blog Specialist, Tableau. Tableau Ambassadors teach and share while fostering a positive and supportive space within the data community. Tableau Ambassadors serve one-year terms in one of seven branches: Forums, User Groups, Student, DataDev, Public, Social, and CRM Analytics. Bronwen Boyd. Britt Staniar.
Social Media and Blog Specialist, Tableau. Tableau Ambassadors teach and share while fostering a positive and supportive space within the data community. Tableau Ambassadors serve one-year terms in one of seven branches: Forums, User Groups, Student, DataDev, Public, Social, and CRM Analytics. Bronwen Boyd. Britt Staniar.
There are many well-known libraries and platforms for data analysis such as Pandas and Tableau, in addition to analytical databases like ClickHouse, MariaDB, Apache Druid, Apache Pinot, Google BigQuery, Amazon RedShift, etc. Datavisualization can help here by visualizing your datasets.
Tableau is a data visualisation software helping you to generate graphics-rich reporting and analysing enormous volumes of data. With the help of Tableau, organisations have been able to mine and gather actionable insights from granular sources of data. Let’s read the blog to find out!
In the world of datavisualization , the ability to produce material that can speak to your audience, regardless of their technical expertise, is an ever-important factor to consider. Tableau Public Tableau Public , a powerful datavisualization software, empowers users to create interactive and shareable dashboards with ease.
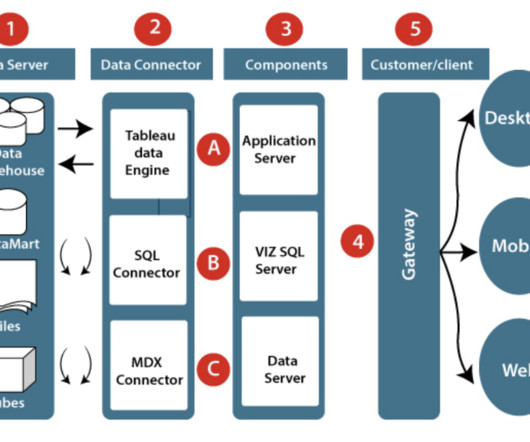
In this world of data-driven, have you ever wondered where this data is stored in Tableau ? Before understanding this data storage, let us know a bit about Tableau. Tableau is one of the most popular datavisualization and businessintelligence tools that help people see and understand their data.
In this world of data-driven, have you ever wondered where this data is stored in Tableau ? Before understanding this data storage, let us know a bit about Tableau. Tableau is one of the most popular datavisualization and businessintelligence tools that help people see and understand their data.
Even if you don’t have a degree, you might still be pondering, “How to become a data scientist?” ” Datavisualization and communication It’s not enough to uncover insights from data; a data scientist must also communicate these insights effectively. Works with smaller data sets.
Allison (Ally) Witherspoon Johnston Senior Vice President, Product Marketing, Tableau Bronwen Boyd December 7, 2022 - 11:16pm February 14, 2023 In the quest to become a customer-focused company, the ability to quickly act on insights and deliver personalized customer experiences has never been more important. Up to date. Let’s explore how.
Data scientists try multiple models, evaluate their performance, and fine-tune some parameters to get better accuracy. DataVisualization and Interpretation To make the data understandable to stakeholders, visualizations are created in the form of charts, graphs, and dashboards.
We organize all of the trending information in your field so you don't have to. Join 17,000+ users and stay up to date on the latest articles your peers are reading.
You know about us, now we want to get to know you!
Let's personalize your content
Let's get even more personalized
We recognize your account from another site in our network, please click 'Send Email' below to continue with verifying your account and setting a password.


Let's personalize your content