This site uses cookies to improve your experience. To help us insure we adhere to various privacy regulations, please select your country/region of residence. If you do not select a country, we will assume you are from the United States. Select your Cookie Settings or view our Privacy Policy and Terms of Use.
Cookie Settings
Cookies and similar technologies are used on this website for proper function of the website, for tracking performance analytics and for marketing purposes. We and some of our third-party providers may use cookie data for various purposes. Please review the cookie settings below and choose your preference.
Used for the proper function of the website
Used for monitoring website traffic and interactions
Cookie Settings
Cookies and similar technologies are used on this website for proper function of the website, for tracking performance analytics and for marketing purposes. We and some of our third-party providers may use cookie data for various purposes. Please review the cookie settings below and choose your preference.
Strictly Necessary: Used for the proper function of the website
Performance/Analytics: Used for monitoring website traffic and interactions
Introduction Tableau is a data visualization tool created in Salesforce that allows users to connect to any database, like SQL or MongoDB, and interact freely. It is widely used in the BusinessIntelligence industry, and raw data is quickly simplified to any format […].
This week, Gartner published the 2021 Magic Quadrant for Analytics and BusinessIntelligence Platforms. Gartner has again recognized Tableau as a Leader—for our ninth consecutive year. . I first want to thank you, the Tableau Community, for your continued support and your commitment to data, to Tableau, and to each other.
Technical Fellow, Tableau. Tableau has been helping people and organizations to see and understand data for almost two decades, bringing exciting innovations to the landscape of businessintelligence with every product release. Navigating the History of Tableau Innovation viz. Jock Mackinlay. Bronwen Boyd.
Big or small, every business needs good tools to analyze data and develop the most suitable business strategy based on the information they get. Businessintelligence tools are means that help companies get insights from their data and get a better understanding of what directions and trends to follow. Boost Productivity.
Think your customers will pay more for data visualizations in your application? Five years ago they may have. But today, dashboards and visualizations have become table stakes. Discover which features will differentiate your application and maximize the ROI of your embedded analytics. Brought to you by Logi Analytics.
Open source businessintelligence software is a game-changer in the world of data analysis and decision-making. It has revolutionized the way businesses approach data analytics by providing cost-effective and customizable solutions that are tailored to specific business needs. What is open source businessintelligence?
Technical Fellow, Tableau. Tableau has been helping people and organizations to see and understand data for almost two decades, bringing exciting innovations to the landscape of businessintelligence with every product release. Navigating the History of Tableau Innovation viz. Jock Mackinlay. Bronwen Boyd.
In addition to BusinessIntelligence (BI), Process Mining is no longer a new phenomenon, but almost all larger companies are conducting this data-driven process analysis in their organization. For analysis the way of BusinessIntelligence this normalized data model can already be used.
Summary: Data Visualisation is crucial to ensure effective representation of insights tableau vs power bi are two popular tools for this. This article compares Tableau and Power BI, examining their features, pricing, and suitability for different organisations. What is Tableau? billion in 2023. from 2022 to 2028.
Summary: BusinessIntelligence tools are software applications that help organizations collect, process, analyse, and visualize data from various sources. These tools transform raw data into actionable insights, enabling businesses to make informed decisions, improve operational efficiency, and adapt to market trends effectively.
Summary: BusinessIntelligence Analysts transform raw data into actionable insights. Key skills include SQL, data visualization, and business acumen. From customer interactions to market trends, every aspect of business generates a wealth of information. What Is BusinessIntelligence?
In today’s fast-paced business landscape, companies need to stay ahead of the curve to remain competitive. Businessintelligence (BI) has emerged as a key solution to help companies gain insights into their operations and market trends. What is businessintelligence?
In today’s fast-paced business landscape, companies need to stay ahead of the curve to remain competitive. Businessintelligence (BI) has emerged as a key solution to help companies gain insights into their operations and market trends. What is businessintelligence?
This week, Gartner published the 2021 Magic Quadrant for Analytics and BusinessIntelligence Platforms. Gartner has again recognized Tableau as a Leader—for our ninth consecutive year. . I first want to thank you, the Tableau Community, for your continued support and your commitment to data, to Tableau, and to each other.
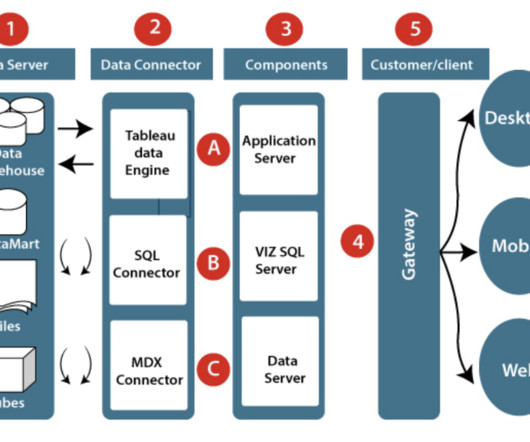
Summary: Understanding BusinessIntelligence Architecture is essential for organizations seeking to harness data effectively. By implementing a robust BI architecture, businesses can make informed decisions, optimize operations, and gain a competitive edge in their industries. What is BusinessIntelligence Architecture?
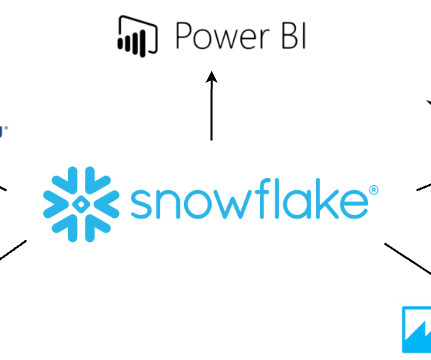
Businessintelligence (BI) has become the cornerstone of decision making for businesses, leading organizations to constantly seek innovative solutions to harness the power of their data. Snowflake Data Cloud, a cloud-native data platform, has emerged as a leading choice for businessintelligence (BI) initiatives.
In this world of data-driven, have you ever wondered where this data is stored in Tableau ? Before understanding this data storage, let us know a bit about Tableau. Tableau is one of the most popular data visualization and businessintelligence tools that help people see and understand their data.
In this world of data-driven, have you ever wondered where this data is stored in Tableau ? Before understanding this data storage, let us know a bit about Tableau. Tableau is one of the most popular data visualization and businessintelligence tools that help people see and understand their data.
The application presents a massive volume of unstructured data through a graphical or programming interface using the analytical abilities of businessintelligence technology to provide instant insight. Druid is a real-time analytics database from Apache. Google BigQuery also claims to provide 99.99% uptime SLA.
Tableau is a data visualisation software helping you to generate graphics-rich reporting and analysing enormous volumes of data. With the help of Tableau, organisations have been able to mine and gather actionable insights from granular sources of data. But What is Tableau for Data Science and what are its advantages and disadvantages?
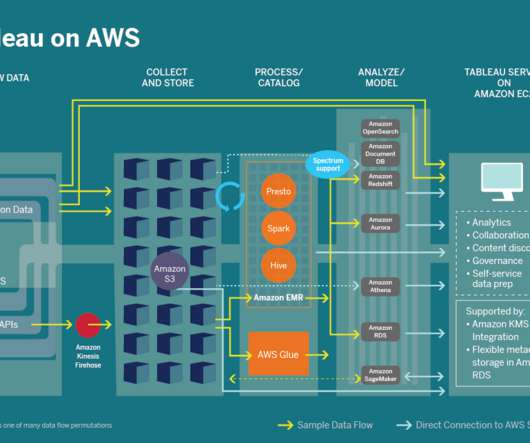
Senior Product Manager, Tableau. Having a comprehensive technology stack in the cloud can support the data integration, self-service analytics, and use cases that businesses need to digitally transform and achieve analytics at scale. Core product integration and connectivity between Tableau and AWS. Jason Dudek. Kevin Glover.
Senior Product Manager, Tableau. Having a comprehensive technology stack in the cloud can support the data integration, self-service analytics, and use cases that businesses need to digitally transform and achieve analytics at scale. Core product integration and connectivity between Tableau and AWS. Jason Dudek. Kevin Glover.
Director of Global Industry Advisors, Retail and Consumer Goods Lead, Tableau. Fortunately, a modern data stack (MDS) using Fivetran, Snowflake, and Tableau makes it easier to pull data from new and various systems, combine it into a single source of truth, and derive fast, actionable insights. Jeff Huckaby. Kristin Adderson.
Director, Product Management, Tableau. Having a comprehensive technology stack in the cloud can support the data integration, self-service analytics, and use cases that businesses need to digitally transform and achieve analytics at scale. Core product integration and connectivity between Tableau and AWS. Jason Dudek.
TableauTableau is a leading data visualization tool known for its powerful capabilities and user-friendly interface. Wide Range of Data Sources : Connects to databases, spreadsheets, and Big Data platforms. Use Cases Ideal for businesses needing to analyse large datasets and create detailed visualizations.
So, what are the best analytics tools for businesses in 2021? Things are always changing in the digital landscape, but here are some great options companies can use to create more informed business strategies. One of the biggest benefits of Tableau is that the software is free and extremely versatile. RapidMiner.
Businessintelligence has a long history. How will moving to true self-service businessintelligence — and achieving data democracy — impact your organization? A Short History of BusinessIntelligence. Modern businessintelligence starts at the dawn of digital computing.
There are many well-known libraries and platforms for data analysis such as Pandas and Tableau, in addition to analytical databases like ClickHouse, MariaDB, Apache Druid, Apache Pinot, Google BigQuery, Amazon RedShift, etc. VisiData works with CSV files, Excel spreadsheets, SQL databases, and many other data sources.
Overview There are a plethora of data science tools out there – which one should you pick up? Here’s a list of over 20. The post 22 Widely Used Data Science and Machine Learning Tools in 2020 appeared first on Analytics Vidhya.
With databases, for example, choices may include NoSQL, HBase and MongoDB but its likely priorities may shift over time. Basic BusinessIntelligence Experience is a Must. Communication happens to be a critical soft skill of businessintelligence. But it’s not the only skill necessary to thrive.
Introduction In the rapidly evolving landscape of data analytics, BusinessIntelligence (BI) tools have become indispensable for organizations seeking to leverage their big data stores for strategic decision-making. Tableau – Tableau is celebrated for its advanced data visualization and interactive dashboard features.
” Data management and manipulation Data scientists often deal with vast amounts of data, so it’s crucial to understand databases, data architecture, and query languages like SQL. Tools like Tableau, Matplotlib, Seaborn, or Power BI can be incredibly helpful. This is where data visualization comes in.
What is BusinessIntelligence? BusinessIntelligence (BI) refers to the technology, techniques, and practises that are used to gather, evaluate, and present information about an organisation in order to assist decision-making and generate effective administrative action. billion in 2015 and reached around $26.50
There’s a multitude of different reasons why an organization may consider a businessintelligence (BI) platform migration. Cloud-based BI platforms, like Tableau Cloud, also offer additional features and capabilities, such as support for real-time analytics and machine learning , that are not available on on-premises systems.
Director of Global Industry Advisors, Retail and Consumer Goods Lead, Tableau. Fortunately, a modern data stack (MDS) using Fivetran, Snowflake, and Tableau makes it easier to pull data from new and various systems, combine it into a single source of truth, and derive fast, actionable insights. Jeff Huckaby. Kristin Adderson.
A “catalog-first” approach to businessintelligence enables both empowerment and accuracy; and Alation has long enabled this combination over Tableau. Alation’s deep integration with tools like MicroStrategy and Tableau provides visibility into the complete data pipeline: from storage through visualization.
Summary: Power BI alternatives like Tableau, Qlik Sense, and Zoho Analytics provide businesses with tailored Data Analysis and Visualisation solutions. Introduction Power BI has become one of the most popular businessintelligence (BI) tools, offering powerful Data Visualisation, reporting, and decision-making features.
Integration Retail and (CPG) organizations often rely on applications such as inventory lifecycle management, order management systems, and businessintelligence (BI) dashboards, which incorporate forecasting capabilities. To streamline the visualization, SageMaker Canvas provides embedded visualization for exploring forecast results.
Business users will also perform data analytics within businessintelligence (BI) platforms for insight into current market conditions or probable decision-making outcomes. js and Tableau Data science, data analytics and IBM Practicing data science isn’t without its challenges.
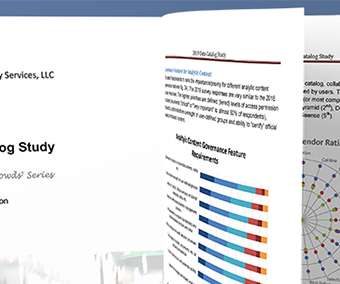
A broader definition of BusinessIntelligence. In their Wisdom of Crowds® Data Catalog Market Study, Dresner assessed data catalog solutions from the perspective of businessintelligence (BI). Howard Dresner coined the term “BusinessIntelligence” in 1989.
In this post, we describe how CBRE partnered with AWS Prototyping to develop a custom query environment allowing natural language query (NLQ) prompts by using Amazon Bedrock, AWS Lambda , Amazon Relational Database Service (Amazon RDS), and Amazon OpenSearch Service. Embeddings were generated using Amazon Titan.
How to Optimize Power BI and Snowflake for Advanced Analytics Spencer Baucke May 25, 2023 The world of businessintelligence and data modernization has never been more competitive than it is today. Microsoft Power BI has been the leader in the analytics and businessintelligence platforms category for several years running.
The demand for information repositories enabling businessintelligence and analytics is growing exponentially, giving birth to cloud solutions. Snowflake Database Pros Extensive Storage Opportunities Snowflake provides affordability, scalability, and a user-friendly interface.
Management and storage of Data in businesses require the use of a Database Management System. It is a query-based language that has the sole purpose of managing relational databases. A relational database is a group of tables from where the generation of data accessing, editing and updating is viable.
We organize all of the trending information in your field so you don't have to. Join 17,000+ users and stay up to date on the latest articles your peers are reading.
You know about us, now we want to get to know you!
Let's personalize your content
Let's get even more personalized
We recognize your account from another site in our network, please click 'Send Email' below to continue with verifying your account and setting a password.


Let's personalize your content