This site uses cookies to improve your experience. To help us insure we adhere to various privacy regulations, please select your country/region of residence. If you do not select a country, we will assume you are from the United States. Select your Cookie Settings or view our Privacy Policy and Terms of Use.
Cookie Settings
Cookies and similar technologies are used on this website for proper function of the website, for tracking performance analytics and for marketing purposes. We and some of our third-party providers may use cookie data for various purposes. Please review the cookie settings below and choose your preference.
Used for the proper function of the website
Used for monitoring website traffic and interactions
Cookie Settings
Cookies and similar technologies are used on this website for proper function of the website, for tracking performance analytics and for marketing purposes. We and some of our third-party providers may use cookie data for various purposes. Please review the cookie settings below and choose your preference.
Strictly Necessary: Used for the proper function of the website
Performance/Analytics: Used for monitoring website traffic and interactions
The Datamarts capability opens endless possibilities for organizations to achieve their data analytics goals on the PowerBI platform. Before we look into the PowerBI Datamarts, let us take a step back and understand the meaning of a Datamart. What is PowerBI Datamarts?
Summary : Microsoft Fabric is an end-to-end Data Analytics platform designed for integration, processing, and advanced insights, while PowerBI excels in creating interactive visualisations and reports. The objective is to guide businesses, Data Analysts, and decision-makers in choosing the right tool for their needs.
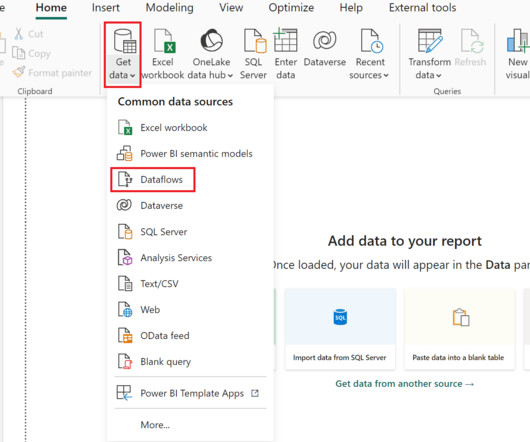
We at phData have written extensively about creating centralized data products in PowerBI. Most PowerBI developers are familiar with Power Query , Which is the data transformation layer of PowerBI. Dataflows are one of the data products that can be created in Fabric’s PowerBI workload.
Summary: BusinessIntelligence tools are software applications that help organizations collect, process, analyse, and visualize data from various sources. These tools transform raw data into actionable insights, enabling businesses to make informed decisions, improve operational efficiency, and adapt to market trends effectively.
Summary: BusinessIntelligence Analysts transform raw data into actionable insights. Key skills include SQL, data visualization, and business acumen. From customer interactions to market trends, every aspect of business generates a wealth of information. What Is BusinessIntelligence?
Among these tools, KNIME and PowerBI have emerged as key players, catering to the demands of this evolving landscape. Microsoft PowerBI has established itself as a premier data visualization product used to turn unrelated data sources into coherent, visually immersive, and interactive insights.
In today’s fast-paced business landscape, companies need to stay ahead of the curve to remain competitive. Businessintelligence (BI) has emerged as a key solution to help companies gain insights into their operations and market trends. What is businessintelligence?
In today’s fast-paced business landscape, companies need to stay ahead of the curve to remain competitive. Businessintelligence (BI) has emerged as a key solution to help companies gain insights into their operations and market trends. What is businessintelligence?
Summary: Understanding BusinessIntelligence Architecture is essential for organizations seeking to harness data effectively. By implementing a robust BI architecture, businesses can make informed decisions, optimize operations, and gain a competitive edge in their industries. What is BusinessIntelligence Architecture?
PowerBI Datamarts is one of the most exciting features that Microsoft has released for the Power Platform in recent years. If you need high-level information on what a PowerBI Datamart is and some example use cases, check out our other blog, What Are PowerBI Datamarts?
The project I did to land my businessintelligence internship — CAR BRAND SEARCH ETL PROCESS WITH PYTHON, POSTGRESQL & POWERBI 1. Section 2: Explanation of the ETL diagram for the project. ETL ARCHITECTURE DIAGRAM ETL stands for Extract, Transform, Load. Figure 5: pgAdmin website 2.4.
The popular tools, on the other hand, include PowerBI, ETL, IBM Db2, and Teradata. Basic BusinessIntelligence Experience is a Must. Communication happens to be a critical soft skill of businessintelligence. For frameworks and languages, there’s SAS, Python, R, Apache Hadoop and many others.
What is BusinessIntelligence? BusinessIntelligence (BI) refers to the technology, techniques, and practises that are used to gather, evaluate, and present information about an organisation in order to assist decision-making and generate effective administrative action. What Does a BI Developer Do?
Reverse ETL tools. Businessintelligence (BI) platforms. The modern data stack is also the consequence of a shift in analysis workflow, fromextract, transform, load (ETL) to extract, load, transform (ELT). A Note on the Shift from ETL to ELT. Examples of BI tools include Looker, PowerBI , and Tableau.
Users can quickly identify key trends, outliers , and data relationships, making it easier to make informed decisions based on comprehensive, AI-powered analysis. Power Query Power Query is another transformative AI tool that simplifies data extraction, transformation, and loading ( ETL ).
Introduction Dimensional modelling is a design approach used in data warehousing and businessintelligence that structures data into a format that is intuitive and efficient for querying and reporting. One of the key components of dimensional modelling is the concept of hierarchies.
ETL Tools Informatica, Talend, and Apache Airflow enable the extraction of data from source systems, transformation into the desired format, and loading into the dimensional model. These tools help streamline the design process and ensure consistency. These tools are essential for populating fact tables with accurate and timely data.
Data Warehousing and ETL Processes What is a data warehouse, and why is it important? It is essential to provide a unified data view and enable businessintelligence and analytics. Explain the Extract, Transform, Load (ETL) process. Have you worked with cloud-based data platforms like AWS, Google Cloud, or Azure?
Summary: PowerBI is a businessintelligence tool that transforms raw data into actionable insights. PowerBI enhances decision-making by providing interactive dashboards and reports that are accessible to both technical and non-technical users. What Is PowerBI?
It is commonly used for analytics and businessintelligence, helping organisations make data-driven decisions. It allows businesses to store and analyse large datasets without worrying about infrastructure management. Looker : A businessintelligence tool for data exploration and visualization.
We organize all of the trending information in your field so you don't have to. Join 17,000+ users and stay up to date on the latest articles your peers are reading.
You know about us, now we want to get to know you!
Let's personalize your content
Let's get even more personalized
We recognize your account from another site in our network, please click 'Send Email' below to continue with verifying your account and setting a password.


Let's personalize your content