This site uses cookies to improve your experience. To help us insure we adhere to various privacy regulations, please select your country/region of residence. If you do not select a country, we will assume you are from the United States. Select your Cookie Settings or view our Privacy Policy and Terms of Use.
Cookie Settings
Cookies and similar technologies are used on this website for proper function of the website, for tracking performance analytics and for marketing purposes. We and some of our third-party providers may use cookie data for various purposes. Please review the cookie settings below and choose your preference.
Used for the proper function of the website
Used for monitoring website traffic and interactions
Cookie Settings
Cookies and similar technologies are used on this website for proper function of the website, for tracking performance analytics and for marketing purposes. We and some of our third-party providers may use cookie data for various purposes. Please review the cookie settings below and choose your preference.
Strictly Necessary: Used for the proper function of the website
Performance/Analytics: Used for monitoring website traffic and interactions
Companies use BusinessIntelligence (BI), Data Science , and Process Mining to leverage data for better decision-making, improve operational efficiency, and gain a competitive edge. So while Process Mining can be seen as a subpart of BI while both are using MachineLearning for better analytical results.
As the use of intelligence technologies is staggering, knowing the latest trends in businessintelligence is a must. The market for businessintelligence services is expected to reach $33.5 top 5 key platforms that control the future of businessintelligence impacts BI may have on your business in the future.
Open source businessintelligence software is a game-changer in the world of data analysis and decision-making. It has revolutionized the way businesses approach data analytics by providing cost-effective and customizable solutions that are tailored to specific business needs. What is open source businessintelligence?
Big or small, every business needs good tools to analyze data and develop the most suitable business strategy based on the information they get. Businessintelligence tools are means that help companies get insights from their data and get a better understanding of what directions and trends to follow. Boost Productivity.
Summary: Data Visualisation is crucial to ensure effective representation of insights tableau vs powerbi are two popular tools for this. This article compares Tableau and PowerBI, examining their features, pricing, and suitability for different organisations. What is PowerBI? billion in 2023.
These are platforms that integrate the field of data analytics with artificial intelligence (AI) and machinelearning (ML) solutions. PowerBI Wizard It is a popular businessintelligence tool that empowers you to explore data. What is OpenAI’s GPT Store?
Summary : Microsoft Fabric is an end-to-end Data Analytics platform designed for integration, processing, and advanced insights, while PowerBI excels in creating interactive visualisations and reports. The objective is to guide businesses, Data Analysts, and decision-makers in choosing the right tool for their needs.
In the modern era of data-driven decision-making, businessintelligence projects have become the cornerstone for organizations aiming to harness their data for strategic insights. The BI landscape continues to evolve, with innovative projects taking center stage. As technology evolves, so do the business models.
Data Analysis and Modeling This stage is focused on discovering patterns, trends, and insights through statistical methods, machine-learning models, and algorithms. Some of the famous tools and libraries are Python’s scikit-learn, TensorFlow, PyTorch, and R. Their insights must be in line with real-world goals.
Microsoft PowerBI with Copilot Microsoft PowerBI has integrated genAI through its Copilot feature , transforming how users interact with data. The Copilot in PowerBI allows users to generate reports, visualizations, and insights using natural language queries, making advanced analytics accessible to a broader audience.
Summary: PowerBI is a businessintelligence tool that transforms raw data into actionable insights. PowerBI enhances decision-making by providing interactive dashboards and reports that are accessible to both technical and non-technical users. What Is PowerBI?
Summary: This blog dives into the most promising PowerBI projects, exploring advanced data visualization, AI integration, IoT & blockchain analytics, and emerging technologies. Introduction to PowerBI Project s The world of Data Analysis is constantly evolving, and PowerBI stands at the forefront of this transformation.
Summary: In PowerBI, slicers and filters serve distinct purposes. Introduction In today’s data-driven world, businesses rely heavily on analytics to make informed decisions. Introduction In today’s data-driven world, businesses rely heavily on analytics to make informed decisions. What are Slicers in PowerBI?
Summary: BusinessIntelligence tools are software applications that help organizations collect, process, analyse, and visualize data from various sources. These tools transform raw data into actionable insights, enabling businesses to make informed decisions, improve operational efficiency, and adapt to market trends effectively.
Among these tools, KNIME and PowerBI have emerged as key players, catering to the demands of this evolving landscape. Microsoft PowerBI has established itself as a premier data visualization product used to turn unrelated data sources into coherent, visually immersive, and interactive insights.
In addition to BusinessIntelligence (BI), Process Mining is no longer a new phenomenon, but almost all larger companies are conducting this data-driven process analysis in their organization. The measured timestamps (and duration times in case of Task Mining) are enhanced with a time-dimension for BI applications.
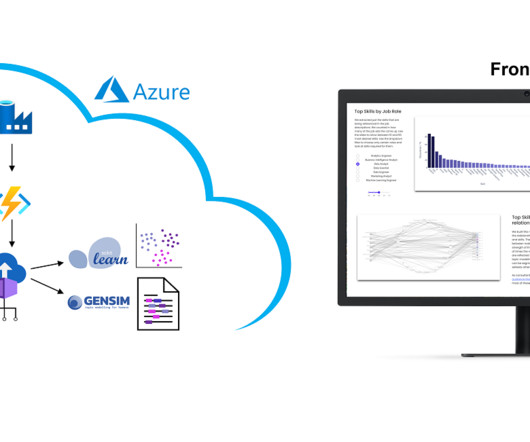
The skill clusters are formed via the discipline of Topic Modelling , a method from unsupervised machinelearning , which show the differences in the distribution of requirements between them. Over the time, it will provides you the answer on your questions related to which tool to learn! Why we did it?
Explore, analyze, and visualize data with our Introduction to PowerBI training & make data-driven decisions. 2. In this panel, we will discuss how MLOps can help overcome challenges in operationalizing machinelearning models, such as version control, deployment, and monitoring.
Summary: Understanding BusinessIntelligence Architecture is essential for organizations seeking to harness data effectively. By implementing a robust BI architecture, businesses can make informed decisions, optimize operations, and gain a competitive edge in their industries. What is BusinessIntelligence Architecture?
QGIS, Microsoft's PowerBI, Tableau, and Jupyter notebooks also facilitated many interesting visualizations, particularly for solvers with less programming experience. an initiative that seeks to simplify the code documentation process for software developers by utilizing machinelearning for automation. He holds a B.S.
It’s important to build a solid CV by working with businesses and teams that fit a specialization, so choose one. MachineLearning Experience is a Must. Machinelearning technology and its growing capability is a huge driver of that automation. Basic BusinessIntelligence Experience is a Must.
The application of Artificial intelligence and BusinessIntelligence in affiliate marketing has been actively discussed for quite a time. Companies like Propel Media are using machinelearning to deliver ads to customers that are most likely to convert. BusinessIntelligence.
Summary: Explore a range of top AI and MachineLearning courses that cover fundamental to advanced concepts, offering hands-on projects and industry insights. Introduction Artificial Intelligence (AI) and MachineLearning are revolutionising industries by enabling smarter decision-making and automation.
Coding skills are essential for tasks such as data cleaning, analysis, visualization, and implementing machinelearning algorithms. MachinelearningMachinelearning is a key part of data science. It involves developing algorithms that can learn from and make predictions or decisions based on data.
These are platforms that integrate the field of data analytics with artificial intelligence (AI) and machinelearning (ML) solutions. PowerBI Wizard It is a popular businessintelligence tool that empowers you to explore data. What is OpenAI’s GPT Store?
At its core, decision intelligence involves collecting and integrating relevant data from various sources, such as databases, text documents, and APIs. This data is then analyzed using statistical methods, machinelearning algorithms, and data mining techniques to uncover meaningful patterns and relationships.
PowerBI Wizard It is a popular businessintelligence tool that empowers you to explore data. It uses machinelearning and natural language processing for automation and enhancement of data analytical processes. Other outputs include database diagrams and code visualizations.
Overview: Data science vs data analytics Think of data science as the overarching umbrella that covers a wide range of tasks performed to find patterns in large datasets, structure data for use, train machinelearning models and develop artificial intelligence (AI) applications.
Introduction In the rapidly evolving landscape of data analytics, BusinessIntelligence (BI) tools have become indispensable for organizations seeking to leverage their big data stores for strategic decision-making. There is a plethora of BI tools available in the market today, with new ones being added yearly.
They use data visualisation tools like Tableau and PowerBI to create compelling reports. Additionally, familiarity with MachineLearning frameworks and cloud-based platforms like AWS or Azure adds value to their expertise. Key Features: Diverse Modules: Covers statistics, Python programming, and MachineLearning.
Ideas (Analyse Data) Excel’s Ideas feature, or Analyse Data, brings powerful AI-driven insights directly into your spreadsheets. This feature uses MachineLearning algorithms to detect patterns and anomalies, providing actionable insights without requiring complex formulas or manual analysis.
What is BusinessIntelligence? BusinessIntelligence (BI) refers to the technology, techniques, and practises that are used to gather, evaluate, and present information about an organisation in order to assist decision-making and generate effective administrative action. What Does a BI Developer Do?
EVENT — ODSC East 2024 In-Person and Virtual Conference April 23rd to 25th, 2024 Join us for a deep dive into the latest data science and AI trends, tools, and techniques, from LLMs to data analytics and from machinelearning to responsible AI.
Expertise in tools like PowerBI, SQL, and Python is crucial. Expertise in programs like Microsoft Excel, SQL , and businessintelligence (BI) tools like PowerBI or Tableau allows analysts to process and visualise data efficiently. AI and automation play a central role in the evolving role.
EVENT — ODSC East 2024 In-Person and Virtual Conference April 23rd to 25th, 2024 Join us for a deep dive into the latest data science and AI trends, tools, and techniques, from LLMs to data analytics and from machinelearning to responsible AI.
Tableau is a powerful data visualization and businessintelligence tool that can be effectively used by professionals in the field of data science. They can leverage the power of R or Python to develop complex models and then visualize the results in Tableau for better understanding and communication.
Summary: The difference between Data Science and Data Analytics lies in their approachData Science uses AI and MachineLearning for predictions, while Data Analytics focuses on analysing past trends. Key Takeaways Data Science uses AI and MachineLearning for predictive modelling and automation. What is Data Science?
There are three main types, each serving a distinct purpose: Descriptive Analytics (BusinessIntelligence): This focuses on understanding what happened. ” Predictive Analytics (MachineLearning): This uses historical data to predict future outcomes. ” or “What are our customer demographics?”
It covers essential topics such as SQL queries, data visualization, statistical analysis, machinelearning concepts, and data manipulation techniques. Statistical Analysis: Learn the Central Limit Theorem, correlation, and basic calculations like mean, median, and mode. The median is the middle value in a sorted list of numbers.
AWS Prototyping successfully delivered a scalable prototype, which solved CBRE’s business problem with a high accuracy rate (over 95%) and supported reuse of embeddings for similar NLQs, and an API gateway for integration into CBRE’s dashboards.
Key tools include: BusinessIntelligence (BI) Tools : Software like Tableau or PowerBI allows users to visualise and analyse complex datasets easily. MachineLearning Algorithms: These algorithms can identify patterns in data and make predictions based on historical trends.
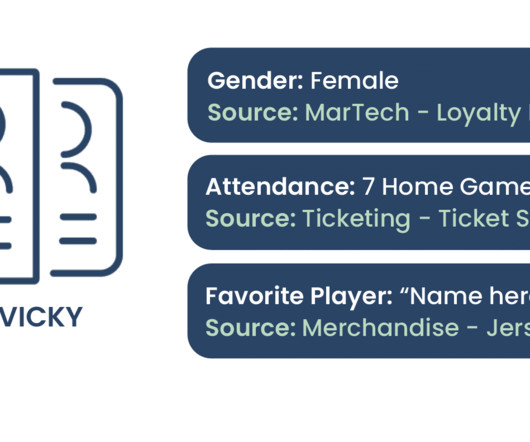
Step 2: Analyze the Data Once you have centralized your data, use a businessintelligence tool like Sigma Computing , PowerBI , Tableau , or another to craft analytics dashboards. The future of the Fan 360 holds exciting possibilities with the combination of AI and MachineLearning.
Key tools include: BusinessIntelligence (BI) Tools : Software like Tableau or PowerBI allows users to visualise and analyse complex datasets easily. MachineLearning Algorithms: These algorithms can identify patterns in data and make predictions based on historical trends.
Modeling & Algorithms: Applying statistical models (like regression, classification, clustering) or MachineLearning algorithms to identify deeper patterns, make predictions, or classify data points. to understand the data’s main characteristics, distributions, and relationships. This helps formulate hypotheses.
We organize all of the trending information in your field so you don't have to. Join 17,000+ users and stay up to date on the latest articles your peers are reading.
You know about us, now we want to get to know you!
Let's personalize your content
Let's get even more personalized
We recognize your account from another site in our network, please click 'Send Email' below to continue with verifying your account and setting a password.


Let's personalize your content