This site uses cookies to improve your experience. To help us insure we adhere to various privacy regulations, please select your country/region of residence. If you do not select a country, we will assume you are from the United States. Select your Cookie Settings or view our Privacy Policy and Terms of Use.
Cookie Settings
Cookies and similar technologies are used on this website for proper function of the website, for tracking performance analytics and for marketing purposes. We and some of our third-party providers may use cookie data for various purposes. Please review the cookie settings below and choose your preference.
Used for the proper function of the website
Used for monitoring website traffic and interactions
Cookie Settings
Cookies and similar technologies are used on this website for proper function of the website, for tracking performance analytics and for marketing purposes. We and some of our third-party providers may use cookie data for various purposes. Please review the cookie settings below and choose your preference.
Strictly Necessary: Used for the proper function of the website
Performance/Analytics: Used for monitoring website traffic and interactions
Introduction Welcome, data enthusiasts and aspiring PowerBI professionals! If you’re gearing up for a PowerBI interview, you’re probably aware of the dynamic nature of the businessintelligence world.
Introduction Microsoft’s PowerBI is one of its rapidly growing corporate analytics services. This self-service businessintelligence tool is the latest and greatest in the data-driven industry. The post Microsoft’s PowerBI Interview Questions appeared first on Analytics Vidhya.
PowerBI is used for Businessintelligence. The post Building your First PowerBI Report from Scratch appeared first on Analytics Vidhya. Introduction In this article, we will explore one of Microsoft’s proprietary products, “PowerBI”, in-depth. And […].
Among numerous available exciting career choices, PowerBI developer is one of the intriguing career options among professionals. With data analysis, visualization, interpretation, and businessintelligence skills, setting your foot and heading over others requires consistency, practice, and an innovative mindset.
Understanding popular businessintelligence tools and their unique features is crucial for harnessing their true potential. Both MS Excel and PowerBI offer impressive capabilities regarding data analysis and decision-making. This […] The post Excel vs PowerBI – Which is a Better for Decision Making?
Introduction PowerBI uses a set of functions, operators, and constants called DAX to perform dynamic computations and analysis. One can enhance their PowerBI competency by using DAX features that help in data modeling and reporting. This article examines the top DAX features that any PowerBI user should know.
Introduction We have worked on plenty of drag-and-drop tools in our businessintelligence (BI) journey. The post 10 Useful Data Analysis Expressions (DAX) Functions for PowerBI Beginners appeared first on Analytics Vidhya. But none has come close to matching the Swiss.
Overview Analytics and BusinessIntelligence provide comprehensible view of the company and derive actionable insights. We’ll discuss 6 top businessintelligence tools that you. The post 6 Top Tools for Analytics and BusinessIntelligence in 2020 appeared first on Analytics Vidhya.
Microsoft PowerBI is a collection of apps, software services, The post Rise of Microsoft PowerBI as a Data Analytics powerhouse appeared first on Analytics Vidhya. ArticleVideo Book This article was published as a part of the Data Science Blogathon.
Summary: This PowerBI DAX tutorial introduces beginners to the fundamentals of Data Analysis Expressions, including syntax, functions, and context. It covers creating measures and calculated columns, using aggregate functions, and applying time intelligence for advanced Data Analysis. What is DAX?
Creating a visual that includes profit amount and profit margin is easy if you know the right DAX expressions to use in PowerBI. The post How to calculate profit margin in Microsoft PowerBI using a calculated column appeared first on TechRepublic.
Businessintelligence is a crucial component in the chase to be on the top in this competitive corporate sphere. Employing an analytical system in a data-driven business can help it to discover useful trends, information, conclusions and elevated decision making.
Or regularly build dashboards and visualizations in Tableau or PowerBI? The post Infographic: 11 Steps to Transition into Data Science (for Reporting / MIS / BI Professionals) appeared first on Analytics Vidhya. Introduction Do you often work with reports in Excel? If you answered yes.
Businessintelligence is an integral part of any business strategy. Businessintelligence software can integrate information and present it in dashboards, reports, or graphs. Sixty-four percent of BI users have felt it was very helpful. Are you looking for powerbi consulting services ?
As the use of intelligence technologies is staggering, knowing the latest trends in businessintelligence is a must. The market for businessintelligence services is expected to reach $33.5 top 5 key platforms that control the future of businessintelligence impacts BI may have on your business in the future.
Row-level security is a powerful data governance capability across many businessintelligence platforms, and PowerBI is no exception. Learning how to implement row-level security is critical for any PowerBI developer hoping to add an extra layer of security to their reports and datasets.
More and more often, businesses are using data to drive their decisions — which makes cutting-edge analytics and businessintelligence strategies one of the best advantages a company can have. Here are the six trends you should be aware of that will reshape businessintelligence in 2020 and throughout the new decade.
In the sales context, this helps monitor sales data in PowerBI reports and trigger alerts or actions based on real-time changes, ensuring that sales teams can respond quickly to critical events. This opens another tab of PowerBI , where you can visualize the sales data and create interactive dashboards. Choose a visual of interest.
PowerBI Desktop is a wonderful businessintelligence tool that has an expansive list of reporting capabilities, but there is one thing that you aren’t able to do with it – create a paginated report, which is a specific style of report that is designed to be exported or printed. What Is PowerBI Report Builder?
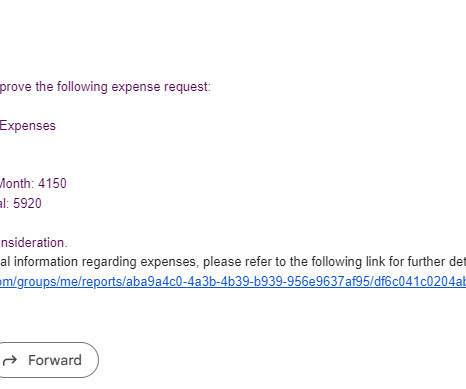
By integrating Power Automate workflows with your PowerBI report, you can develop robust business solutions and automate processes such as updating data, sending data driven alerts , requesting approvals, and more. In this blog, we will walk you through how to integrate Power Automate workflows with PowerBI.
How to Optimize PowerBI and Snowflake for Advanced Analytics Spencer Baucke May 25, 2023 The world of businessintelligence and data modernization has never been more competitive than it is today. Table of Contents Why Discuss Snowflake & PowerBI?
Open source businessintelligence software is a game-changer in the world of data analysis and decision-making. It has revolutionized the way businesses approach data analytics by providing cost-effective and customizable solutions that are tailored to specific business needs. What is open source businessintelligence?
Companies use BusinessIntelligence (BI), Data Science , and Process Mining to leverage data for better decision-making, improve operational efficiency, and gain a competitive edge. Data Mesh on Azure Cloud with Databricks and Delta Lake for Applications of BusinessIntelligence, Data Science and Process Mining.
Summary: Data Visualisation is crucial to ensure effective representation of insights tableau vs powerbi are two popular tools for this. This article compares Tableau and PowerBI, examining their features, pricing, and suitability for different organisations. What is PowerBI? billion in 2023.
Big or small, every business needs good tools to analyze data and develop the most suitable business strategy based on the information they get. Businessintelligence tools are means that help companies get insights from their data and get a better understanding of what directions and trends to follow. Boost Productivity.
PowerBI is a businessintelligence platform that allows businesses to share reports and datasets within the PowerBI Service , the cloud environment of the tool. What Does it Mean to “Share” a PowerBI Dataset? Why Share PowerBI Datasets?
One of the great things about PowerBI is all of the native connectors that exist, making it extremely easy for developers to seamlessly connect to the source system and pull their data into PowerBI. Check out this blog on how to enable SSO for Snowflake in PowerBI.
Summary : Microsoft Fabric is an end-to-end Data Analytics platform designed for integration, processing, and advanced insights, while PowerBI excels in creating interactive visualisations and reports. The objective is to guide businesses, Data Analysts, and decision-makers in choosing the right tool for their needs.
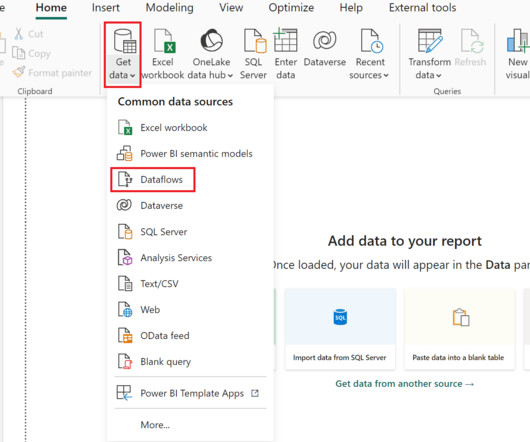
As businesses shift towards cloud-based solutions in data analytics and businessintelligence, many forward-thinking organizations seek to leverage the latest and greatest of technologies to enhance their reporting capabilities. Step 1 Open PowerBI Desktop and then click on Get Data to connect to SQL Server.
Summary: PowerBI is a businessintelligence tool that transforms raw data into actionable insights. PowerBI enhances decision-making by providing interactive dashboards and reports that are accessible to both technical and non-technical users. What Is PowerBI?
There is a massive infiltration of technologies like businessintelligence. The end objective is to make an informed business decision. In this blog, we will unfold the benefits of PowerBI and key PowerBI features , along with other details. What is PowerBI? billion by 2028.
Summary: PowerBI is a business analytics tool transforming data into actionable insights. Key features include AI-powered analytics, extensive data connectivity, customisation options, and robust data modelling. Why PowerBI? PowerBI Desktop : A Windows application used for creating reports.
Summary: PowerBI alternatives like Tableau, Qlik Sense, and Zoho Analytics provide businesses with tailored Data Analysis and Visualisation solutions. Introduction PowerBI has become one of the most popular businessintelligence (BI) tools, offering powerful Data Visualisation, reporting, and decision-making features.
The Datamarts capability opens endless possibilities for organizations to achieve their data analytics goals on the PowerBI platform. Before we look into the PowerBI Datamarts, let us take a step back and understand the meaning of a Datamart. What is PowerBI Datamarts?
Summary: This blog dives into the most promising PowerBI projects, exploring advanced data visualization, AI integration, IoT & blockchain analytics, and emerging technologies. Introduction to PowerBI Project s The world of Data Analysis is constantly evolving, and PowerBI stands at the forefront of this transformation.
Summary: In PowerBI, slicers and filters serve distinct purposes. Introduction In today’s data-driven world, businesses rely heavily on analytics to make informed decisions. Introduction In today’s data-driven world, businesses rely heavily on analytics to make informed decisions. What are Slicers in PowerBI?
We at phData have written extensively about creating centralized data products in PowerBI. Most PowerBI developers are familiar with Power Query , Which is the data transformation layer of PowerBI. Dataflows are one of the data products that can be created in Fabric’s PowerBI workload.
Summary: Counting rows is a fundamental task in PowerBI that requires careful consideration. This blog explores how to get total number of rows in power query. Understanding PowerBI and Its Importance PowerBI is a suite of business analytics tools that allows users to analyze data and share insights.
Summary: PowerBI is a leading data analytics platform offering advanced features like real-time analytics and collaborative capabilities. Understanding its significance is vital for aspiring PowerBI developers. Mastering PowerBI can significantly enhance career prospects, given its prevalence in the industry.
PowerBI Heatmap: Heatmap in PowerBI refers to the type of custom visualisation that businesses analysts utilise for showcasing the relationship between two variables on a map in different colour patches. It helps the user in visualising the patterns which are hidden and observe the changes across each axis.
Driving a data culture is now a lot more — well, driven — thanks to the latest of Alation’s 80+ connectors : PowerBI Scanner, which unifies self-service and enterprise analytics and allows users to find answers fast with industry-leading AI. What Is the Significance of the Alation & PowerBI Partnership?
Among these tools, KNIME and PowerBI have emerged as key players, catering to the demands of this evolving landscape. Microsoft PowerBI has established itself as a premier data visualization product used to turn unrelated data sources into coherent, visually immersive, and interactive insights.
Summary: BusinessIntelligence tools are software applications that help organizations collect, process, analyse, and visualize data from various sources. These tools transform raw data into actionable insights, enabling businesses to make informed decisions, improve operational efficiency, and adapt to market trends effectively.
In the modern era of data-driven decision-making, businessintelligence projects have become the cornerstone for organizations aiming to harness their data for strategic insights. The BI landscape continues to evolve, with innovative projects taking center stage. But this diversity often leads to sound pollution.
We organize all of the trending information in your field so you don't have to. Join 17,000+ users and stay up to date on the latest articles your peers are reading.
You know about us, now we want to get to know you!
Let's personalize your content
Let's get even more personalized
We recognize your account from another site in our network, please click 'Send Email' below to continue with verifying your account and setting a password.


Let's personalize your content