This site uses cookies to improve your experience. To help us insure we adhere to various privacy regulations, please select your country/region of residence. If you do not select a country, we will assume you are from the United States. Select your Cookie Settings or view our Privacy Policy and Terms of Use.
Cookie Settings
Cookies and similar technologies are used on this website for proper function of the website, for tracking performance analytics and for marketing purposes. We and some of our third-party providers may use cookie data for various purposes. Please review the cookie settings below and choose your preference.
Used for the proper function of the website
Used for monitoring website traffic and interactions
Cookie Settings
Cookies and similar technologies are used on this website for proper function of the website, for tracking performance analytics and for marketing purposes. We and some of our third-party providers may use cookie data for various purposes. Please review the cookie settings below and choose your preference.
Strictly Necessary: Used for the proper function of the website
Performance/Analytics: Used for monitoring website traffic and interactions
Introduction Microsoft’s PowerBI is one of its rapidly growing corporate analytics services. This self-service businessintelligence tool is the latest and greatest in the data-driven industry. The post Microsoft’s PowerBI Interview Questions appeared first on Analytics Vidhya.
In the modern era of data-driven decision-making, businessintelligence projects have become the cornerstone for organizations aiming to harness their data for strategic insights. The BI landscape continues to evolve, with innovative projects taking center stage. But this diversity often leads to sound pollution.
Among these tools, KNIME and PowerBI have emerged as key players, catering to the demands of this evolving landscape. Microsoft PowerBI has established itself as a premier data visualization product used to turn unrelated data sources into coherent, visually immersive, and interactive insights.
Businessintelligence (BI) users often struggle to access the high-quality, relevant data necessary to inform strategic decision making. The consumer can create a “Python script” connection in Microsoft PowerBI and start creating BI reports for further BI analysis on data products.
It is capable of writing and running Python codes. PowerBI Wizard It is a popular businessintelligence tool that empowers you to explore data. Once you provide relevant prompts of focus to the GPT, it can generate appropriate data visuals based on the information from the uploaded files.
Summary: BusinessIntelligence Analysts transform raw data into actionable insights. Key skills include SQL, data visualization, and business acumen. From customer interactions to market trends, every aspect of business generates a wealth of information. What Is BusinessIntelligence?
In today’s fast-paced business landscape, companies need to stay ahead of the curve to remain competitive. Businessintelligence (BI) has emerged as a key solution to help companies gain insights into their operations and market trends. What is businessintelligence?
In today’s fast-paced business landscape, companies need to stay ahead of the curve to remain competitive. Businessintelligence (BI) has emerged as a key solution to help companies gain insights into their operations and market trends. What is businessintelligence?
Explore, analyze, and visualize data with our Introduction to PowerBI training & make data-driven decisions. 2. Take advantage of this opportunity to learn how to harness the power of deep learning for improved customer support at scale. Want to dive deep into Python?
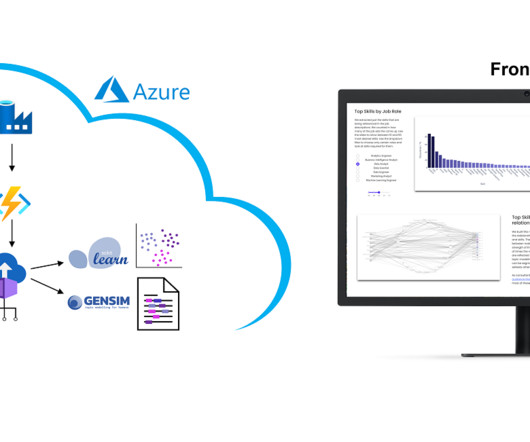
However, we collect these over time and will make trends secure, for example how the demand for Python, SQL or specific tools such as dbt or PowerBI changes. The presentation is currently limited to the current situation on the labor market. Why we did it? It is a nice show-case many people are interested in.
The processes of SQL, Python scripts, and web scraping libraries such as BeautifulSoup or Scrapy are used for carrying out the data collection. Tools like Python (with pandas and NumPy), R, and ETL platforms like Apache NiFi or Talend are used for data preparation before analysis.
Most submissions utilized popular Python libraries like geopandas , rasterio , xarray , and matplotlib. QGIS, Microsoft's PowerBI, Tableau, and Jupyter notebooks also facilitated many interesting visualizations, particularly for solvers with less programming experience. Rowan is a BusinessIntelligence Analyst at HunaTek.
The project I did to land my businessintelligence internship — CAR BRAND SEARCH ETL PROCESS WITH PYTHON, POSTGRESQL & POWERBI 1. Section 3: The technical section for the project where Python and pgAdmin4 will be used. CODING STAGE In this stage we are going to code in Python 3.9 Windows NT 10.0;
They use data visualisation tools like Tableau and PowerBI to create compelling reports. Programming languages such as Python and R are essential for advanced analytics. Are you aiming for an entry-level role or looking to specialise in a particular area of Data Analytics, such as Machine Learning or BusinessIntelligence?
Programming skills A proficient data scientist should have strong programming skills, typically in Python or R, which are the most commonly used languages in the field. Tools like Tableau, Matplotlib, Seaborn, or PowerBI can be incredibly helpful. This is where data visualization comes in.
Introduction Data visualization is no longer just a niche skill; it’s a fundamental component of Data Analysis , businessintelligence, and data science. I’ve also started learning and working with Tableau Public [or PowerBI Desktop , Python libraries like Matplotlib/Seaborn , etc.
It is capable of writing and running Python codes. PowerBI Wizard It is a popular businessintelligence tool that empowers you to explore data. Once you provide relevant prompts of focus to the GPT, it can generate appropriate data visuals based on the information from the uploaded files.
For frameworks and languages, there’s SAS, Python, R, Apache Hadoop and many others. The popular tools, on the other hand, include PowerBI, ETL, IBM Db2, and Teradata. Basic BusinessIntelligence Experience is a Must. Communication happens to be a critical soft skill of businessintelligence.
It is capable of writing and running Python codes. PowerBI Wizard It is a popular businessintelligence tool that empowers you to explore data. Once you provide relevant prompts of focus to the GPT, it can generate appropriate data visuals based on the information from the uploaded files.
What is BusinessIntelligence? BusinessIntelligence (BI) refers to the technology, techniques, and practises that are used to gather, evaluate, and present information about an organisation in order to assist decision-making and generate effective administrative action. What Does a BI Developer Do?
An open-source, low-code Python wrapper for easy usage of the Large Language Models such as ChatGPT, AutoGPT, LLaMa, GPT-J, and GPT4All An introduction to “ pychatgpt_gui” — A GUI-based APP for LLM’s with custom-data training and pre-trained inferences. It is an open-source python package. The launched APP snapshot is as seen below.
Business users will also perform data analytics within businessintelligence (BI) platforms for insight into current market conditions or probable decision-making outcomes. Your skill set should include the ability to write in the programming languages Python, SAS, R and Scala.
Microsoft PowerBI Microsoft PowerBI is almost synonymous with comprehensive businessintelligence capabilities. One thing to note is that Looker does require a bit of a learning curve, but once mastered it’s many professionals’ “go-to.”
Expertise in tools like PowerBI, SQL, and Python is crucial. Expertise in programs like Microsoft Excel, SQL , and businessintelligence (BI) tools like PowerBI or Tableau allows analysts to process and visualise data efficiently. AI and automation play a central role in the evolving role.
Course Content: Basics of AI Applications and transformative impact of AI Ethical issues in AI Hands-on projects and expert insights Machine Learning A-Z Course by Udemy This course covers the full spectrum of Machine Learning, from basic concepts to advanced techniques, using Python and R. Hands-on coding exercises in Python and R.
Tableau is a powerful data visualization and businessintelligence tool that can be effectively used by professionals in the field of data science. Tableau also supports advanced statistical modeling through integration with statistical tools like R and Python. How Professionals Can Use Tableau for Data Science?
Tools Commonly Used BusinessIntelligence Platforms: Tableau, Microsoft PowerBI, Qlik Sense, Google Data Studio (Looker Studio) Programming Libraries: Matplotlib, Seaborn (Python); ggplot2 (R); D3.js
AWS Prototyping successfully delivered a scalable prototype, which solved CBRE’s business problem with a high accuracy rate (over 95%) and supported reuse of embeddings for similar NLQs, and an API gateway for integration into CBRE’s dashboards. Currently, the AWS CDK supports TypeScript, JavaScript, Python, Java, C#, and Go.
Businessintelligence (BI) platforms. BusinessIntelligence Tools: Businessintelligence (BI) tools are used to visualize your data. Examples of BI tools include Looker, PowerBI , and Tableau. 4) Start visualizing data using businessintelligence tools.
It is essential to provide a unified data view and enable businessintelligence and analytics. I devised a data cleaning and transformation strategy using Python scripts to standardise the data, which resolved the issue and improved the accuracy of the analysis. How do you handle large datasets in Python?
Also, it provides powerful commands for querying, filtering, sorting, and aggregating data. Python and R Programming languages like Python and R offer rich libraries and frameworks for data manipulation. While Excel is not as powerful as specialized data manipulation tools, it is widely accessible and user-friendly.
They use coding languages like Python or R to build Machine Learning models and automate tasks. A Data Analysts job is to make data easy to understand for businesses, helping them make informed decisions. Tableau and PowerBI : Visualisation tools that create interactive dashboards and reports.
There are three main types, each serving a distinct purpose: Descriptive Analytics (BusinessIntelligence): This focuses on understanding what happened. Tools and Technologies Python/R: Popular programming languages for data analysis and machine learning. ” or “What are our customer demographics?
Dabei arbeiten wir technologie-offen und mit nahezu allen Tools – Und oft in enger Verbindung mit Initiativen der BusinessIntelligence und Data Science. Process Mining wurde kürzlich in die Power Automate Plattform und in PowerBI integriert. – Fluxicon (Disco) ist vom Chart verschwunden.
Tools like Python, SQL, Apache Spark, and Snowflake help engineers automate workflows and improve efficiency. Python, SQL, and Apache Spark are essential for data engineering workflows. PythonPython is one of the most popular programming languages for data engineering.
We organize all of the trending information in your field so you don't have to. Join 17,000+ users and stay up to date on the latest articles your peers are reading.
You know about us, now we want to get to know you!
Let's personalize your content
Let's get even more personalized
We recognize your account from another site in our network, please click 'Send Email' below to continue with verifying your account and setting a password.


Let's personalize your content