This site uses cookies to improve your experience. To help us insure we adhere to various privacy regulations, please select your country/region of residence. If you do not select a country, we will assume you are from the United States. Select your Cookie Settings or view our Privacy Policy and Terms of Use.
Cookie Settings
Cookies and similar technologies are used on this website for proper function of the website, for tracking performance analytics and for marketing purposes. We and some of our third-party providers may use cookie data for various purposes. Please review the cookie settings below and choose your preference.
Used for the proper function of the website
Used for monitoring website traffic and interactions
Cookie Settings
Cookies and similar technologies are used on this website for proper function of the website, for tracking performance analytics and for marketing purposes. We and some of our third-party providers may use cookie data for various purposes. Please review the cookie settings below and choose your preference.
Strictly Necessary: Used for the proper function of the website
Performance/Analytics: Used for monitoring website traffic and interactions
In the sales context, this helps monitor sales data in PowerBI reports and trigger alerts or actions based on real-time changes, ensuring that sales teams can respond quickly to critical events. Let’s use SQL operations on this delta table to see if the table is stored. Choose a visual of interest.
PowerBI Desktop is a wonderful businessintelligence tool that has an expansive list of reporting capabilities, but there is one thing that you aren’t able to do with it – create a paginated report, which is a specific style of report that is designed to be exported or printed. What Is PowerBI Report Builder?
How to Optimize PowerBI and Snowflake for Advanced Analytics Spencer Baucke May 25, 2023 The world of businessintelligence and data modernization has never been more competitive than it is today. Table of Contents Why Discuss Snowflake & PowerBI?
Big or small, every business needs good tools to analyze data and develop the most suitable business strategy based on the information they get. Businessintelligence tools are means that help companies get insights from their data and get a better understanding of what directions and trends to follow. Boost Productivity.
Summary: Data Visualisation is crucial to ensure effective representation of insights tableau vs powerbi are two popular tools for this. This article compares Tableau and PowerBI, examining their features, pricing, and suitability for different organisations. What is PowerBI? billion in 2023.
As businesses shift towards cloud-based solutions in data analytics and businessintelligence, many forward-thinking organizations seek to leverage the latest and greatest of technologies to enhance their reporting capabilities. Step 1 Open PowerBI Desktop and then click on Get Data to connect to SQL Server.
Natural Language Query (NLQ) enables users to query databases using everyday language rather than specialized query languages like SQL. For instance, business analytics platforms like Microsoft PowerBI allow users to easily query data related to key performance metrics. What is Natural Language Query (NLQ)?
Summary: PowerBI is a business analytics tool transforming data into actionable insights. Key features include AI-powered analytics, extensive data connectivity, customisation options, and robust data modelling. Supports diverse data sources: Excel, SQL Server, Azure, and more. Why PowerBI?
Summary: PowerBI alternatives like Tableau, Qlik Sense, and Zoho Analytics provide businesses with tailored Data Analysis and Visualisation solutions. Introduction PowerBI has become one of the most popular businessintelligence (BI) tools, offering powerful Data Visualisation, reporting, and decision-making features.
The Datamarts capability opens endless possibilities for organizations to achieve their data analytics goals on the PowerBI platform. Before we look into the PowerBI Datamarts, let us take a step back and understand the meaning of a Datamart. What is PowerBI Datamarts?
Summary : Microsoft Fabric is an end-to-end Data Analytics platform designed for integration, processing, and advanced insights, while PowerBI excels in creating interactive visualisations and reports. The objective is to guide businesses, Data Analysts, and decision-makers in choosing the right tool for their needs.
Summary: PowerBI is a businessintelligence tool that transforms raw data into actionable insights. PowerBI enhances decision-making by providing interactive dashboards and reports that are accessible to both technical and non-technical users. What Is PowerBI?
Summary: PowerBI is a leading data analytics platform offering advanced features like real-time analytics and collaborative capabilities. Understanding its significance is vital for aspiring PowerBI developers. Mastering PowerBI can significantly enhance career prospects, given its prevalence in the industry.
In addition to BusinessIntelligence (BI), Process Mining is no longer a new phenomenon, but almost all larger companies are conducting this data-driven process analysis in their organization. The measured timestamps (and duration times in case of Task Mining) are enhanced with a time-dimension for BI applications.
PowerBI Heatmap: Heatmap in PowerBI refers to the type of custom visualisation that businesses analysts utilise for showcasing the relationship between two variables on a map in different colour patches. It helps the user in visualising the patterns which are hidden and observe the changes across each axis.
Summary: BusinessIntelligence Analysts transform raw data into actionable insights. Key skills include SQL, data visualization, and business acumen. From customer interactions to market trends, every aspect of business generates a wealth of information. What Is BusinessIntelligence?
These models process vast amounts of text data to learn language patterns, enabling them to respond to queries, summarize information, or even generate complex SQL queries based on natural language inputs. Generative AI for Data Analytics – Top 7 Tools to Leverage 1. ” and the Copilot will generate a relevant chart or report.
Explore, analyze, and visualize data with our Introduction to PowerBI training & make data-driven decisions. 2. Getting Started with SQL Programming: Are you starting your journey in data science? Then you’re probably already familiar with SQL, Python, and R for data analysis and machine learning.
The processes of SQL, Python scripts, and web scraping libraries such as BeautifulSoup or Scrapy are used for carrying out the data collection. Visualization libraries available in Python such as Matplotlib and Seaborn, and tools like Tableau and PowerBI become crucial to telling stories that lead to insights.
In today’s fast-paced business landscape, companies need to stay ahead of the curve to remain competitive. Businessintelligence (BI) has emerged as a key solution to help companies gain insights into their operations and market trends. What is businessintelligence?
In today’s fast-paced business landscape, companies need to stay ahead of the curve to remain competitive. Businessintelligence (BI) has emerged as a key solution to help companies gain insights into their operations and market trends. What is businessintelligence?
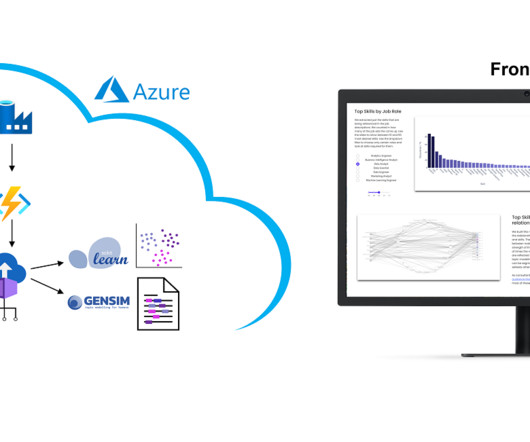
However, we collect these over time and will make trends secure, for example how the demand for Python, SQL or specific tools such as dbt or PowerBI changes. The presentation is currently limited to the current situation on the labor market. Why we did it? It is a nice show-case many people are interested in.
PowerBI Datamarts is one of the most exciting features that Microsoft has released for the Power Platform in recent years. If you need high-level information on what a PowerBI Datamart is and some example use cases, check out our other blog, What Are PowerBI Datamarts?
Summary: Understanding BusinessIntelligence Architecture is essential for organizations seeking to harness data effectively. By implementing a robust BI architecture, businesses can make informed decisions, optimize operations, and gain a competitive edge in their industries. What is BusinessIntelligence Architecture?
PowerBI is a versatile and scalable platform that combines self-service and enterprise businessintelligence (BI) capabilities. Data Analysis Expressions (DAX) is the formula expression language employed in PowerBI. What is the SWITCH Function?
” Data management and manipulation Data scientists often deal with vast amounts of data, so it’s crucial to understand databases, data architecture, and query languages like SQL. Tools like Tableau, Matplotlib, Seaborn, or PowerBI can be incredibly helpful. This is where data visualization comes in.
Software like Microsoft Excel and SQL helps them manipulate and query data efficiently. They use data visualisation tools like Tableau and PowerBI to create compelling reports. Key Features: Hands-on Training: Covers real-world Data Analysis methodologies, SQL , Python, and visualisation.
In today’s rapidly evolving digital landscape, seamless data, applications, and device integration are more pressing than ever. Enter Microsoft Fabric, a cutting-edge solution designed to revolutionize how we interact with technology.
AWS Prototyping successfully delivered a scalable prototype, which solved CBRE’s business problem with a high accuracy rate (over 95%) and supported reuse of embeddings for similar NLQs, and an API gateway for integration into CBRE’s dashboards. The wrapper function runs the SQL query using psycopg2.
Introduction In the rapidly evolving landscape of data analytics, BusinessIntelligence (BI) tools have become indispensable for organizations seeking to leverage their big data stores for strategic decision-making. There is a plethora of BI tools available in the market today, with new ones being added yearly.
The popular tools, on the other hand, include PowerBI, ETL, IBM Db2, and Teradata. Basic BusinessIntelligence Experience is a Must. Communication happens to be a critical soft skill of businessintelligence. For frameworks and languages, there’s SAS, Python, R, Apache Hadoop and many others.
What is BusinessIntelligence? BusinessIntelligence (BI) refers to the technology, techniques, and practises that are used to gather, evaluate, and present information about an organisation in order to assist decision-making and generate effective administrative action. What Does a BI Developer Do?
The most vital aspect of automating powerbi DevOps is to understand the main pillars in the SQL DevOps cycle. Any DevOps services company can tell you that microservices in modern business have many notable links to the DevOps process. Truly, assembly lines are one of the best examples of DevOps and automation.
Expertise in tools like PowerBI, SQL, and Python is crucial. Expertise in programs like Microsoft Excel, SQL , and businessintelligence (BI) tools like PowerBI or Tableau allows analysts to process and visualise data efficiently.
Business users will also perform data analytics within businessintelligence (BI) platforms for insight into current market conditions or probable decision-making outcomes. Data analytics is a task that resides under the data science umbrella and is done to query, interpret and visualize datasets.
Introduction Dimensional modelling is a design approach used in data warehousing and businessintelligence that structures data into a format that is intuitive and efficient for querying and reporting. One of the key components of dimensional modelling is the concept of hierarchies.
Proficiency in tools such as Excel, SQL, and businessintelligence platforms can significantly enhance their effectiveness. Excel, SQL), project management tools (e.g., Trello, Asana), and businessintelligence platforms (e.g., Tableau, PowerBI) to perform their duties effectively.
Consequently, if your results, scores, etc are stored in an SQL Database, Tableau can be able to quickly visualise easily your model metrics. With SQL queries Tableau helps in integrating with them effectively. Accordingly, Tableau Data Scientist salary is generally more than those experts having specialisation in PowerBI.
It covers essential topics such as SQL queries, data visualization, statistical analysis, machine learning concepts, and data manipulation techniques. Key Takeaways SQL Mastery: Understand SQL’s importance, join tables, and distinguish between SELECT and SELECT DISTINCT. How do you join tables in SQL?
Focus on Data Science tools and businessintelligence. Practical skills in SQL, Python, and Machine Learning. Hands-on experience through a 1-month internship. Guaranteed job placement upon course completion. Practical projects and 1:1 project reviews. Focus on career-essential soft skills.
Tools Commonly Used BusinessIntelligence Platforms: Tableau, Microsoft PowerBI, Qlik Sense, Google Data Studio (Looker Studio) Programming Libraries: Matplotlib, Seaborn (Python); ggplot2 (R); D3.js
Businessintelligence (BI) platforms. A legacy data stack usually refers to the traditional relational database management system (RDBMS), which uses a structured query language (SQL) to store and process data. SQL, however, remains a popular query language for both legacy and modern data stacks. Reverse ETL tools.
SQL (Structured Query Language) SQL is a standard language for managing relational databases. Also, it provides powerful commands for querying, filtering, sorting, and aggregating data. SQL is commonly used for data manipulation tasks, especially with structured datasets.
BusinessIntelligence (BI) Tools BI Tools such as Tableau, PowerBI, and Qlik Sense allow users to create interactive visualisations and dashboards based on dimensional models, enabling effective data exploration and analysis.
We organize all of the trending information in your field so you don't have to. Join 17,000+ users and stay up to date on the latest articles your peers are reading.
You know about us, now we want to get to know you!
Let's personalize your content
Let's get even more personalized
We recognize your account from another site in our network, please click 'Send Email' below to continue with verifying your account and setting a password.


Let's personalize your content