This site uses cookies to improve your experience. To help us insure we adhere to various privacy regulations, please select your country/region of residence. If you do not select a country, we will assume you are from the United States. Select your Cookie Settings or view our Privacy Policy and Terms of Use.
Cookie Settings
Cookies and similar technologies are used on this website for proper function of the website, for tracking performance analytics and for marketing purposes. We and some of our third-party providers may use cookie data for various purposes. Please review the cookie settings below and choose your preference.
Used for the proper function of the website
Used for monitoring website traffic and interactions
Cookie Settings
Cookies and similar technologies are used on this website for proper function of the website, for tracking performance analytics and for marketing purposes. We and some of our third-party providers may use cookie data for various purposes. Please review the cookie settings below and choose your preference.
Strictly Necessary: Used for the proper function of the website
Performance/Analytics: Used for monitoring website traffic and interactions
Introduction Tableau is a data visualization tool created in Salesforce that allows users to connect to any database, like SQL or MongoDB, and interact freely. It is widely used in the BusinessIntelligence industry, and raw data is quickly simplified to any format […].
The main role in decision-making reflected in this choice is assigned to BusinessIntelligence Analyst who provides relevant information to be used in decision-making. This role is very crucial in the ability […] The post Who is a BusinessIntelligence Analyst and How to Become One?
While different companies, regardless of their size, have different operational processes, they share a common need for actionable insight to drive success in their business. Advancement in big data technology has made the world of business even more competitive. This eliminates guesswork when coming up with business strategies.
Technical Fellow, Tableau. Tableau has been helping people and organizations to see and understand data for almost two decades, bringing exciting innovations to the landscape of businessintelligence with every product release. Navigating the History of Tableau Innovation viz. Jock Mackinlay. Bronwen Boyd.
Big or small, every business needs good tools to analyze data and develop the most suitable business strategy based on the information they get. Businessintelligence tools are means that help companies get insights from their data and get a better understanding of what directions and trends to follow. Boost Productivity.
dbt focuses on transforming raw data into analytics-ready tables using SQL-based transformations. Looker: Looker is a businessintelligence and data visualization platform. 10 Tableau: Tableau is a widely used businessintelligence and data visualization tool.
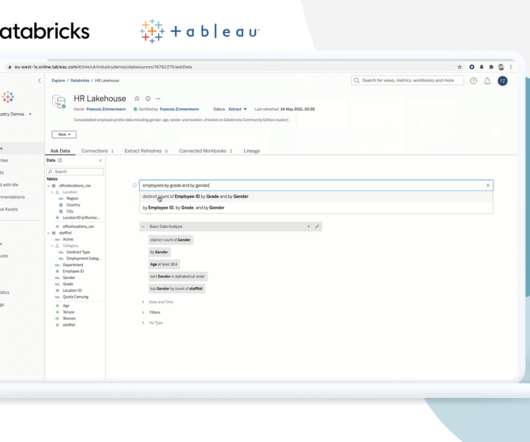
EMEA Field CTO, Tableau. In many of the conversations we have with IT and business leaders, there is a sense of frustration about the speed of time-to-value for big data and data science projects. The lakehouse model provides distinct advantages for Tableau customers. Francois Zimmermann. Brian Dirking. Kristin Adderson.
Technical Fellow, Tableau. Tableau has been helping people and organizations to see and understand data for almost two decades, bringing exciting innovations to the landscape of businessintelligence with every product release. Navigating the History of Tableau Innovation viz. Jock Mackinlay. Bronwen Boyd.
Summary: Data Visualisation is crucial to ensure effective representation of insights tableau vs power bi are two popular tools for this. This article compares Tableau and Power BI, examining their features, pricing, and suitability for different organisations. What is Tableau? billion in 2023. from 2022 to 2028.
Summary: BusinessIntelligence Analysts transform raw data into actionable insights. Key skills include SQL, data visualization, and business acumen. From customer interactions to market trends, every aspect of business generates a wealth of information. What Is BusinessIntelligence?
In addition to BusinessIntelligence (BI), Process Mining is no longer a new phenomenon, but almost all larger companies are conducting this data-driven process analysis in their organization. For analysis the way of BusinessIntelligence this normalized data model can already be used.
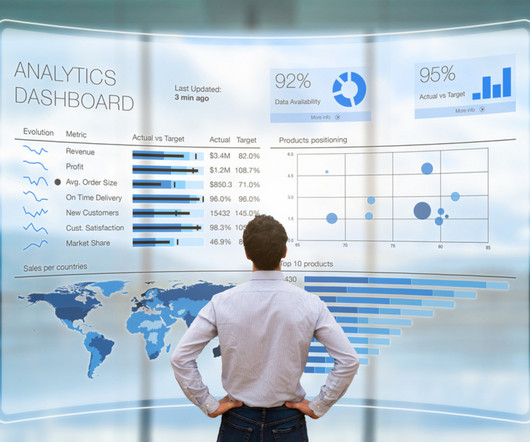
In today’s fast-paced business landscape, companies need to stay ahead of the curve to remain competitive. Businessintelligence (BI) has emerged as a key solution to help companies gain insights into their operations and market trends. What is businessintelligence?
In today’s fast-paced business landscape, companies need to stay ahead of the curve to remain competitive. Businessintelligence (BI) has emerged as a key solution to help companies gain insights into their operations and market trends. What is businessintelligence?
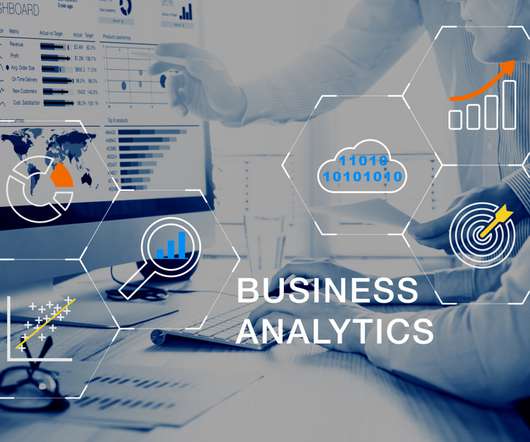
Summary: Understanding BusinessIntelligence Architecture is essential for organizations seeking to harness data effectively. By implementing a robust BI architecture, businesses can make informed decisions, optimize operations, and gain a competitive edge in their industries. What is BusinessIntelligence Architecture?
These models process vast amounts of text data to learn language patterns, enabling them to respond to queries, summarize information, or even generate complex SQL queries based on natural language inputs. It democratizes access to data analytics across an organization.
The processes of SQL, Python scripts, and web scraping libraries such as BeautifulSoup or Scrapy are used for carrying out the data collection. Visualization libraries available in Python such as Matplotlib and Seaborn, and tools like Tableau and Power BI become crucial to telling stories that lead to insights.
Tableau is a data visualisation software helping you to generate graphics-rich reporting and analysing enormous volumes of data. With the help of Tableau, organisations have been able to mine and gather actionable insights from granular sources of data. But What is Tableau for Data Science and what are its advantages and disadvantages?
Software like Microsoft Excel and SQL helps them manipulate and query data efficiently. They use data visualisation tools like Tableau and Power BI to create compelling reports. Are you aiming for an entry-level role or looking to specialise in a particular area of Data Analytics, such as Machine Learning or BusinessIntelligence?
” Data management and manipulation Data scientists often deal with vast amounts of data, so it’s crucial to understand databases, data architecture, and query languages like SQL. Tools like Tableau, Matplotlib, Seaborn, or Power BI can be incredibly helpful. Machine learning Machine learning is a key part of data science.
EMEA Field CTO, Tableau. In many of the conversations we have with IT and business leaders, there is a sense of frustration about the speed of time-to-value for big data and data science projects. The lakehouse model provides distinct advantages for Tableau customers. Francois Zimmermann. Brian Dirking. Kristin Adderson.
The easiest skill that a Data Science aspirant might develop is SQL. Management and storage of Data in businesses require the use of a Database Management System. This blog would an introduction to SQL for Data Science which would cover important aspects of SQL, its need in Data Science, and features and applications of SQL.
So, what are the best analytics tools for businesses in 2021? Things are always changing in the digital landscape, but here are some great options companies can use to create more informed business strategies. One of the biggest benefits of Tableau is that the software is free and extremely versatile. RapidMiner.
AWS Prototyping successfully delivered a scalable prototype, which solved CBRE’s business problem with a high accuracy rate (over 95%) and supported reuse of embeddings for similar NLQs, and an API gateway for integration into CBRE’s dashboards. The wrapper function runs the SQL query using psycopg2.
Overview There are a plethora of data science tools out there – which one should you pick up? Here’s a list of over 20. The post 22 Widely Used Data Science and Machine Learning Tools in 2020 appeared first on Analytics Vidhya.
There are many well-known libraries and platforms for data analysis such as Pandas and Tableau, in addition to analytical databases like ClickHouse, MariaDB, Apache Druid, Apache Pinot, Google BigQuery, Amazon RedShift, etc. VisiData works with CSV files, Excel spreadsheets, SQL databases, and many other data sources.
Basic BusinessIntelligence Experience is a Must. Communication happens to be a critical soft skill of businessintelligence. SQL programming skills, specific tool experience — Tableau for example — and problem-solving are just a handful of examples. But it’s not the only skill necessary to thrive.
Introduction In the rapidly evolving landscape of data analytics, BusinessIntelligence (BI) tools have become indispensable for organizations seeking to leverage their big data stores for strategic decision-making. Examples include SQl, DWH, and Cloud based systems (Google Bigquery). Selecting the right one can seem daunting.
What is BusinessIntelligence? BusinessIntelligence (BI) refers to the technology, techniques, and practises that are used to gather, evaluate, and present information about an organisation in order to assist decision-making and generate effective administrative action. billion in 2015 and reached around $26.50
Summary: Power BI alternatives like Tableau, Qlik Sense, and Zoho Analytics provide businesses with tailored Data Analysis and Visualisation solutions. Introduction Power BI has become one of the most popular businessintelligence (BI) tools, offering powerful Data Visualisation, reporting, and decision-making features.
Users only need to include the respective path in the SQL query to get to work. In addition to supporting standard SQL, Apache Drill lets you keep depending on businessintelligence tools you may already use, such as Qlik and Tableau. It allows secure and interactive SQL analytics at the petabyte scale.
TrustCheck also integrates with third-party businessintelligence tools through our native APIs and is immediately available in Alation V R1 with Tableau Server and Salesforce Einstein analytics. That leads to the question, “How do I know which Tableau data sources to trust?” Conclusion.
How to Optimize Power BI and Snowflake for Advanced Analytics Spencer Baucke May 25, 2023 The world of businessintelligence and data modernization has never been more competitive than it is today. Microsoft Power BI has been the leader in the analytics and businessintelligence platforms category for several years running.
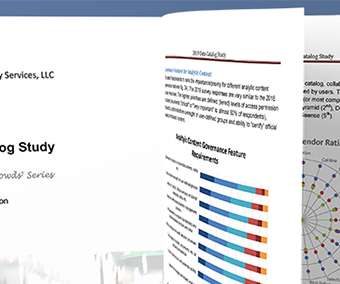
A broader definition of BusinessIntelligence. In their Wisdom of Crowds® Data Catalog Market Study, Dresner assessed data catalog solutions from the perspective of businessintelligence (BI). Howard Dresner coined the term “BusinessIntelligence” in 1989.
Business users will also perform data analytics within businessintelligence (BI) platforms for insight into current market conditions or probable decision-making outcomes. js and Tableau Data science, data analytics and IBM Practicing data science isn’t without its challenges.
The demand for information repositories enabling businessintelligence and analytics is growing exponentially, giving birth to cloud solutions. Implementation of BusinessIntelligence All businessintelligence operations heavily rely on quality data, making data warehousing a crucial part of the process.
This includes mastering the programming languages like Python and SQL. In addition, demonstrable proficiency in Data Analytics software and businessintelligence also helps. If you are willing to become a Data Analyst, familiarity with tools like Python, SQL, and visualization tools like Tableau is always helpful.
Expertise in tools like Power BI, SQL, and Python is crucial. Expertise in programs like Microsoft Excel, SQL , and businessintelligence (BI) tools like Power BI or Tableau allows analysts to process and visualise data efficiently. AI and automation play a central role in the evolving role.
Effectively, Data Analysts use other tools like SQL, R or Python, Excel, etc., Accordingly, the main job of Data Analysts is to help businesses make data-driven decisions and improve their business performance. in manipulating and analysing the data.
Businessintelligence (BI) platforms. Later, BI tools such as Chartio, Looker, and Tableau arrived on the data scene. A legacy data stack usually refers to the traditional relational database management system (RDBMS), which uses a structured query language (SQL) to store and process data. Reverse ETL tools.
The modules that you can complete include data visualization and analysis, data warehousing, prescriptive analysis, predictive analysis and analytics capstone, and you will also have the chance to use software and technology that you will be using in the workplace, such as Tableau, SQL, Python, and SPSS.
It covers essential topics such as SQL queries, data visualization, statistical analysis, machine learning concepts, and data manipulation techniques. Key Takeaways SQL Mastery: Understand SQL’s importance, join tables, and distinguish between SELECT and SELECT DISTINCT. How do you join tables in SQL?
Introduction Dimensional modelling is a design approach used in data warehousing and businessintelligence that structures data into a format that is intuitive and efficient for querying and reporting. One of the key components of dimensional modelling is the concept of hierarchies.
Proficiency in tools such as Excel, SQL, and businessintelligence platforms can significantly enhance their effectiveness. Excel, SQL), project management tools (e.g., Trello, Asana), and businessintelligence platforms (e.g., Tableau, Power BI) to perform their duties effectively.
Focus on Data Science tools and businessintelligence. Practical skills in SQL, Python, and Machine Learning. Key Features: Comprehensive curriculum with 10 modules and 246 lessons. Hands-on experience through a 1-month internship. Guaranteed job placement upon course completion. Practical projects and 1:1 project reviews.
We organize all of the trending information in your field so you don't have to. Join 17,000+ users and stay up to date on the latest articles your peers are reading.
You know about us, now we want to get to know you!
Let's personalize your content
Let's get even more personalized
We recognize your account from another site in our network, please click 'Send Email' below to continue with verifying your account and setting a password.


Let's personalize your content