This site uses cookies to improve your experience. To help us insure we adhere to various privacy regulations, please select your country/region of residence. If you do not select a country, we will assume you are from the United States. Select your Cookie Settings or view our Privacy Policy and Terms of Use.
Cookie Settings
Cookies and similar technologies are used on this website for proper function of the website, for tracking performance analytics and for marketing purposes. We and some of our third-party providers may use cookie data for various purposes. Please review the cookie settings below and choose your preference.
Used for the proper function of the website
Used for monitoring website traffic and interactions
Cookie Settings
Cookies and similar technologies are used on this website for proper function of the website, for tracking performance analytics and for marketing purposes. We and some of our third-party providers may use cookie data for various purposes. Please review the cookie settings below and choose your preference.
Strictly Necessary: Used for the proper function of the website
Performance/Analytics: Used for monitoring website traffic and interactions
Overview Microsoft Excel is one of the most widely used tools for dataanalysis Learn the essential Excel functions used to analyze data for. The post 10+ Simple Yet Powerful Excel Tricks for DataAnalysis appeared first on Analytics Vidhya.
In this blog, we will discuss exploratory dataanalysis, also known as EDA, and why it is important. We will also be sharing code snippets so you can try out different analysis techniques yourself. This can be useful for identifying patterns and trends in the data. So, without any further ado let’s dive right in.
Are you curious about what it takes to become a professional data scientist? By following these guides, you can transform yourself into a skilled data scientist and unlock endless career opportunities. Look no further!
Introduction SQL (Structured Query Language) is a powerful dataanalysis and manipulation tool, playing a crucial role in drawing valuable insights from large datasets in data science. To enhance SQL skills and gain practical experience, real-world projects are essential.
Let’s dive into the fascinating world of H1B visa data from the Office of Foreign Labor Certification […] The post Is H1B Visa Approved Based On The Insights Of DataAnalysis? Thousands of talented professionals enter the US through this program each year, contributing to various industries and driving innovation.
By handling these issues, data preprocessing helps pave the way for more reliable and meaningful analysis. Importance of data preprocessing The role of data preprocessing cannot be overstated, as it significantly influences the quality of the dataanalysis process.
This article was published as a part of the Data Science Blogathon Introduction Do you wish you could perform this function using Pandas. For data scientists who use Python as their primary programming language, the Pandas package is a must-have dataanalysis tool. Well, there is a good possibility you can!
Introduction Data mining is extracting relevant information from a large corpus of natural language. Large data sets are sorted through data mining to find patterns and relationships that may be used in dataanalysis to assist solve business challenges. Thanks to data mining […].
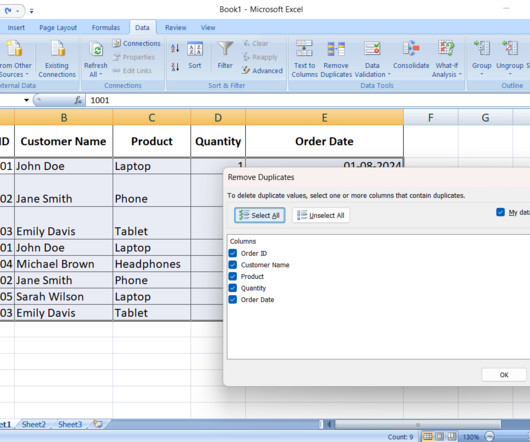
Introduction Accurate and cleandata is the backbone of effective decision-making. Imagine making a critical business decision based on faulty data—it’s a risk you can’t afford. That’s why mastering the skill […] The post How to Remove Duplicates in Excel?
Master ChatGPT for DataAnalysis and Visualization! ChatGPT is a large language model that can be used for a variety of tasks, including dataanalysis and visualization. In this video, you will learn how to use ChatGPT to perform common dataanalysis tasks, such as datacleaning, data exploration, and data visualization.
ArticleVideo Book This article was published as a part of the Data Science Blogathon Pandas Pandas is an open-source dataanalysis and data manipulation library. The post Data Manipulation Using Pandas | Essential Functionalities of Pandas you need to know! appeared first on Analytics Vidhya.
In this tutorial, we will explore these two advanced SQL techniques for dataanalysis. SQL: Data Science and Analytics Roadmap Do you ever wonder what you have to learn to start dataanalysis with SQL? In the next example, we will use a CTE to create a separate table containing cleaneddata.
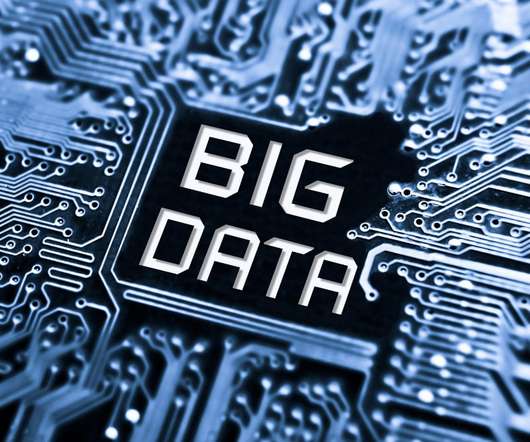
Data types are a defining feature of big data as unstructured data needs to be cleaned and structured before it can be used for data analytics. In fact, the availability of cleandata is among the top challenges facing data scientists.
Datacleaning is the backbone of healthy dataanalysis. When it comes to data, most people believe that the quality of your insights and analysis is only as good as the quality of your data. Garbage data equals garbage analysis out in this case. If you want to establish a.
Summary: Python simplicity, extensive libraries like Pandas and Scikit-learn, and strong community support make it a powerhouse in DataAnalysis. It excels in datacleaning, visualisation, statistical analysis, and Machine Learning, making it a must-know tool for Data Analysts and scientists. Why Python?
Summary: DataAnalysis focuses on extracting meaningful insights from raw data using statistical and analytical methods, while data visualization transforms these insights into visual formats like graphs and charts for better comprehension. Is DataAnalysis just about crunching numbers?
Summary: The Data Science and DataAnalysis life cycles are systematic processes crucial for uncovering insights from raw data. Quality data is foundational for accurate analysis, ensuring businesses stay competitive in the digital landscape. DataCleaningDatacleaning is crucial for data integrity.
Accordingly, Data Analysts use various tools for DataAnalysis and Excel is one of the most common. Significantly, the use of Excel in DataAnalysis is beneficial in keeping records of data over time and enabling data visualization effectively. What is DataAnalysis?
Summary: DataAnalysis and interpretation work together to extract insights from raw data. Analysis finds patterns, while interpretation explains their meaning in real life. Overcoming challenges like data quality and bias improves accuracy, helping businesses and researchers make data-driven choices with confidence.
In-depth dataanalysis using GPT-4’s data visualization toolset. dallE-2: painting in impressionist style with thick oil colors of a map of Europe Efficiency is everything for coders and data analysts. With GPT-4’s Advanced DataAnalysis (ADA) toolset, this process becomes significantly more streamlined.
Photo by Juraj Gabriel on Unsplash Dataanalysis is a powerful tool that helps businesses make informed decisions. In this blog, we’ll be using Python to perform exploratory dataanalysis (EDA) on a Netflix dataset that we’ve found on Kaggle. The type column tells us if it is a TV show or a movie. df.isnull().sum()
Data scientists suffer needlessly when they don’t account for the time it takes to properly complete all of the steps of exploratory dataanalysis There’s a scourge terrorizing data scientists and data science departments across the dataland.
Explore the role and importance of data normalization You might come across certain matches that have missing data on shot outcomes, or any other metric. Correcting these issues ensures your analysis is based on clean, reliable data.
Methodologies in Deploying Data Analytics The application of data analytics in fast food legal cases requires a thorough understanding of the methodologies involved. This involves data collection , datacleaning, dataanalysis, and data interpretation.
For data scrapping a variety of sources, such as online databases, sensor data, or social media. Cleaningdata: Once the data has been gathered, it needs to be cleaned. This involves removing any errors or inconsistencies in the data.
It involves data collection, cleaning, analysis, and interpretation to uncover patterns, trends, and correlations that can drive decision-making. The rise of machine learning applications in healthcare Data scientists, on the other hand, concentrate on dataanalysis and interpretation to extract meaningful insights.
Empowering Data Scientists and Engineers with Lightning-Fast DataAnalysis and Transformation Capabilities Photo by Hans-Jurgen Mager on Unsplash ?Goal Abstract Polars is a fast-growing open-source data frame library that is rapidly becoming the preferred choice for data scientists and data engineers in Python.
In this article, we will discuss how Python runs data preprocessing with its exhaustive machine learning libraries and influences business decision-making. Data Preprocessing is a Requirement. Data preprocessing is converting raw data to cleandata to make it accessible for future use.
He is particularly interested in using object detection and large language models to extract and cleandata from messy local government administrative sources, such as city council meeting minutes and municipal codes. I’m excited to join NYU CDS and work at the intersection of data science and local politics,” said Colner.
Introduction Datacleaning is crucial for any data science project. The collected data has to be clean, accurate, and consistent for any analytical model to function properly and give accurate results. However, this takes up a lot of time, even for experts, as most of the process is manual.
Introduction Effective data management is crucial for organizations of all sizes and in all industries because it helps ensure the accuracy, security, and accessibility of data, which is essential for making good decisions and operating efficiently.
The job opportunities for data scientists will grow by 36% between 2021 and 2031, as suggested by BLS. It has become one of the most demanding job profiles of the current era.
Introduction Stress is a natural response of the body and mind to a demanding or challenging situation. It is the body’s way of reacting to external pressures or internal thoughts and feelings.
Are you a data enthusiast looking to break into the world of analytics? The field of data science and analytics is booming, with exciting career opportunities for those with the right skills and expertise. So, let’s […] The post Data Scientist vs Data Analyst: Which is a Better Career Option to Pursue in 2023?
Introduction Python is a versatile and powerful programming language that plays a central role in the toolkit of data scientists and analysts. Its simplicity and readability make it a preferred choice for working with data, from the most fundamental tasks to cutting-edge artificial intelligence and machine learning.
If you do not take your time to clean up this list, then there is every […] The post What is Data Scrubbing? Introduction Think of the fact that you’re planning a massive family gathering. You have a list of attendees, but it is full of wrong contacts, the same contacts and some of the names in the list are spelled wrongly.
Exploring the Ocean If Big Data is the ocean, Data Science is the multifaceted discipline of extracting knowledge and insights from data, whether it’s big or small. It’s an interdisciplinary field that blends statistics, computer science, and domain expertise to understand phenomena through dataanalysis.
Its underlying Singer framework allows the data teams to customize the pipeline with ease. It detaches from the complicated and computes heavy transformations to deliver cleandata into lakes and DWHs. . K2View leaps at the traditional approach to ETL and ELT tools.
Introduction In the data-driven era, the significance of high-quality data cannot be overstated. The accuracy and reliability of data play a pivotal role in shaping crucial business decisions, impacting an organization’s reputation and long-term success. However, bad or poor-quality data can lead to disastrous outcomes.
Let’s see how good and bad it can be (image created by the author with Midjourney) A big part of most data-related jobs is cleaning the data. There is usually no standard way of cleaningdata, as it can come in numerous different ways.
Introduction Are you struggling to decide between data-driven practices and AI-driven strategies for your business? Besides, there is a balance between the precision of traditional dataanalysis and the innovative potential of explainable artificial intelligence.
R, on the other hand, is renowned for its powerful statistical capabilities, making it ideal for in-depth DataAnalysis and modeling. SQL is essential for querying relational databases, which is a common task in Data Analytics. Extensive libraries for data manipulation, visualization, and statistical analysis.
Data quality is critical for successful dataanalysis. Working with inaccurate or poor quality data may result in flawed outcomes. Hence it is essential to review the data and ensure its quality before beginning the analysis process. However, ignoring this aspect can give you inaccurate results.
The extraction of raw data, transforming to a suitable format for business needs, and loading into a data warehouse. Data transformation. This process helps to transform raw data into cleandata that can be analysed and aggregated. Data analytics and visualisation.
We organize all of the trending information in your field so you don't have to. Join 17,000+ users and stay up to date on the latest articles your peers are reading.
You know about us, now we want to get to know you!
Let's personalize your content
Let's get even more personalized
We recognize your account from another site in our network, please click 'Send Email' below to continue with verifying your account and setting a password.


Let's personalize your content