This site uses cookies to improve your experience. To help us insure we adhere to various privacy regulations, please select your country/region of residence. If you do not select a country, we will assume you are from the United States. Select your Cookie Settings or view our Privacy Policy and Terms of Use.
Cookie Settings
Cookies and similar technologies are used on this website for proper function of the website, for tracking performance analytics and for marketing purposes. We and some of our third-party providers may use cookie data for various purposes. Please review the cookie settings below and choose your preference.
Used for the proper function of the website
Used for monitoring website traffic and interactions
Cookie Settings
Cookies and similar technologies are used on this website for proper function of the website, for tracking performance analytics and for marketing purposes. We and some of our third-party providers may use cookie data for various purposes. Please review the cookie settings below and choose your preference.
Strictly Necessary: Used for the proper function of the website
Performance/Analytics: Used for monitoring website traffic and interactions
In this blog, we will discuss exploratory dataanalysis, also known as EDA, and why it is important. We will also be sharing code snippets so you can try out different analysis techniques yourself. This can be useful for identifying patterns and trends in the data. So, without any further ado let’s dive right in.
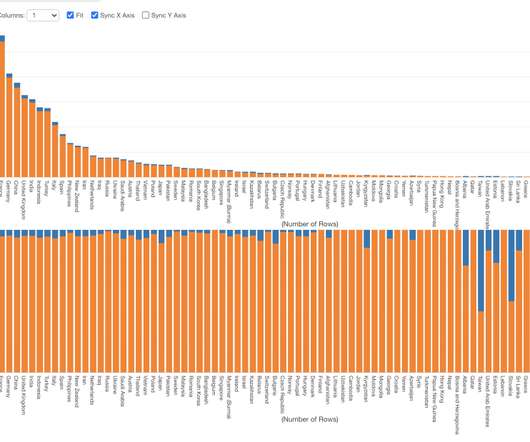
Let’s dive into the fascinating world of H1B visa data from the Office of Foreign Labor Certification […] The post Is H1B Visa Approved Based On The Insights Of DataAnalysis? Thousands of talented professionals enter the US through this program each year, contributing to various industries and driving innovation.
Master ChatGPT for DataAnalysis and Visualization! ChatGPT is a large language model that can be used for a variety of tasks, including dataanalysis and visualization. What are some of the benefits of using Hugging Face and LangKit?
Data types are a defining feature of big data as unstructured data needs to be cleaned and structured before it can be used for data analytics. In fact, the availability of cleandata is among the top challenges facing data scientists.
In-depth dataanalysis using GPT-4’s datavisualization toolset. dallE-2: painting in impressionist style with thick oil colors of a map of Europe Efficiency is everything for coders and data analysts. With GPT-4’s Advanced DataAnalysis (ADA) toolset, this process becomes significantly more streamlined.
It involves data collection, cleaning, analysis, and interpretation to uncover patterns, trends, and correlations that can drive decision-making. The rise of machine learning applications in healthcare Data scientists, on the other hand, concentrate on dataanalysis and interpretation to extract meaningful insights.
Accordingly, Data Analysts use various tools for DataAnalysis and Excel is one of the most common. Significantly, the use of Excel in DataAnalysis is beneficial in keeping records of data over time and enabling datavisualization effectively. What is DataAnalysis?
Summary: The Data Science and DataAnalysis life cycles are systematic processes crucial for uncovering insights from raw data. Quality data is foundational for accurate analysis, ensuring businesses stay competitive in the digital landscape. DataCleaningDatacleaning is crucial for data integrity.
Photo by Juraj Gabriel on Unsplash Dataanalysis is a powerful tool that helps businesses make informed decisions. In this blog, we’ll be using Python to perform exploratory dataanalysis (EDA) on a Netflix dataset that we’ve found on Kaggle. The type column tells us if it is a TV show or a movie. df.isnull().sum()
The final point to which the data has to be eventually transferred is a destination. The destination is decided by the use case of the data pipeline. It can be used to run analytical tools and power datavisualization as well. Otherwise, it can also be moved to a storage centre like a data warehouse or lake.
Introduction Effective data management is crucial for organizations of all sizes and in all industries because it helps ensure the accuracy, security, and accessibility of data, which is essential for making good decisions and operating efficiently.
Introduction Stress is a natural response of the body and mind to a demanding or challenging situation. It is the body’s way of reacting to external pressures or internal thoughts and feelings.
Empowering Data Scientists and Engineers with Lightning-Fast DataAnalysis and Transformation Capabilities Photo by Hans-Jurgen Mager on Unsplash ?Goal Abstract Polars is a fast-growing open-source data frame library that is rapidly becoming the preferred choice for data scientists and data engineers in Python.
Are you a data enthusiast looking to break into the world of analytics? The field of data science and analytics is booming, with exciting career opportunities for those with the right skills and expertise. So, let’s […] The post Data Scientist vs Data Analyst: Which is a Better Career Option to Pursue in 2023?
Introduction Python is a versatile and powerful programming language that plays a central role in the toolkit of data scientists and analysts. Its simplicity and readability make it a preferred choice for working with data, from the most fundamental tasks to cutting-edge artificial intelligence and machine learning.
Imagine data scientists as modern-day detectives who sift through a sea of information to uncover hidden patterns, trends, and correlations that can inform decision-making and drive innovation. Just like sifting through ancient artifacts, they meticulously clean and refine the data, preparing it for the grand unveiling.
R, on the other hand, is renowned for its powerful statistical capabilities, making it ideal for in-depth DataAnalysis and modeling. SQL is essential for querying relational databases, which is a common task in Data Analytics. Extensive libraries for data manipulation, visualization, and statistical analysis.
Individuals with data skills can find a suitable fitment in different industries. Moreover, learning it at a young age can give kids a head start in acquiring the knowledge and skills needed for future career opportunities in DataAnalysis, Machine Learning, and Artificial Intelligence.
We are living in a world where data drives decisions. Data manipulation in Data Science is the fundamental process in dataanalysis. The data professionals deploy different techniques and operations to derive valuable information from the raw and unstructured data.
A cheat sheet for Data Scientists is a concise reference guide, summarizing key concepts, formulas, and best practices in DataAnalysis, statistics, and Machine Learning. It serves as a handy quick-reference tool to assist data professionals in their work, aiding in data interpretation, modeling , and decision-making processes.
Through this process, the data is made very accurate and prepared for analysis. Data wrangling prepares raw data for analysis by cleaning, converting, and manipulating it. It might be a time-consuming operation but it is a necessary stage in dataanalysis.
Raw data often contains inconsistencies, missing values, and irrelevant features that can adversely affect the performance of Machine Learning models. Proper preprocessing helps in: Improving Model Accuracy: Cleandata leads to better predictions. Matplotlib/Seaborn: For datavisualization.
Data scientists must decide on appropriate strategies to handle missing values, such as imputation with mean or median values or removing instances with missing data. The choice of approach depends on the impact of missing data on the overall dataset and the specific analysis or model being used.
Data Wrangler simplifies the data preparation and feature engineering process, reducing the time it takes from weeks to minutes by providing a single visual interface for data scientists to select and cleandata, create features, and automate data preparation in ML workflows without writing any code.
Key Features of Power BI: Power BI is a powerful business intelligence tool developed by Microsoft that enables users to visualize and analyze data from various sources. It offers a wide range of features that make it a popular choice for data professionals, analysts, and organizations.
Your journey ends here where you will learn the essential handy tips quickly and efficiently with proper explanations which will make any type of data importing journey into the Python platform super easy. Introduction Are you a Python enthusiast looking to import data into your code with ease?
The main things are Performance, Prediction, Summary View’s Correlation Mode, Text Data Wrangling UI, and Summarize Table. Performance But the performance to me is probably the most important feature for any dataanalysis tools. Summary View The summary view is the first thing you see once you import your data into Exploratory.
Descriptive Analytics Projects: These projects focus on summarizing historical data to gain insights into past trends and patterns. Examples include generating reports, dashboards, and datavisualizations to understand business performance, customer behavior, or operational efficiency.
The following figure represents the life cycle of data science. It starts with gathering the business requirements and relevant data. Once the data is acquired, it is maintained by performing datacleaning, data warehousing, data staging, and data architecture.
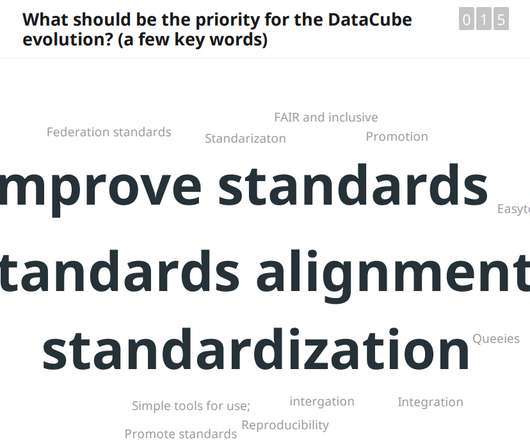
Presenters and participants had the opportunity to hear about and evaluate the pros and cons of different back end technologies and data formats for different uses such as web-mapping, datavisualization, and the sharing of meta-data. These can be cleaned to remove artifacts and/or outdated elements.
Their key roles encompass: Data collection and preparation: Gathering and cleaningdata from multiple sources to ensure it is ready for analysis. Analyzing data trends: Using analytic tools to identify significant patterns and insights for business improvement.
User dataanalysis Chattermill is made for apps with tons of users, like BlaBlaCar and Uber. Datavisualization For a long time, Tableau led the industry in datavisualization. This service works with equations and data in spreadsheet form. Meeting minutes from Neuroslav 3. Documenting with ChatPRD 9.
We organize all of the trending information in your field so you don't have to. Join 17,000+ users and stay up to date on the latest articles your peers are reading.
You know about us, now we want to get to know you!
Let's personalize your content
Let's get even more personalized
We recognize your account from another site in our network, please click 'Send Email' below to continue with verifying your account and setting a password.


Let's personalize your content