This site uses cookies to improve your experience. To help us insure we adhere to various privacy regulations, please select your country/region of residence. If you do not select a country, we will assume you are from the United States. Select your Cookie Settings or view our Privacy Policy and Terms of Use.
Cookie Settings
Cookies and similar technologies are used on this website for proper function of the website, for tracking performance analytics and for marketing purposes. We and some of our third-party providers may use cookie data for various purposes. Please review the cookie settings below and choose your preference.
Used for the proper function of the website
Used for monitoring website traffic and interactions
Cookie Settings
Cookies and similar technologies are used on this website for proper function of the website, for tracking performance analytics and for marketing purposes. We and some of our third-party providers may use cookie data for various purposes. Please review the cookie settings below and choose your preference.
Strictly Necessary: Used for the proper function of the website
Performance/Analytics: Used for monitoring website traffic and interactions
Introduction SQL (Structured Query Language) is a powerful dataanalysis and manipulation tool, playing a crucial role in drawing valuable insights from large datasets in data science. To enhance SQL skills and gain practical experience, real-world projects are essential.
Are you curious about what it takes to become a professional data scientist? By following these guides, you can transform yourself into a skilled data scientist and unlock endless career opportunities. Look no further!
Two tools in SQL are specifically designed for this purpose: subqueries and CTEs. In this tutorial, we will explore these two advanced SQL techniques for dataanalysis. Get the SQL roadmap for free! SQL: Data Science and Analytics Roadmap Do you ever wonder what you have to learn to start dataanalysis with SQL?
Summary: DataAnalysis focuses on extracting meaningful insights from raw data using statistical and analytical methods, while data visualization transforms these insights into visual formats like graphs and charts for better comprehension. Is DataAnalysis just about crunching numbers?
It involves data collection, cleaning, analysis, and interpretation to uncover patterns, trends, and correlations that can drive decision-making. The rise of machine learning applications in healthcare Data scientists, on the other hand, concentrate on dataanalysis and interpretation to extract meaningful insights.
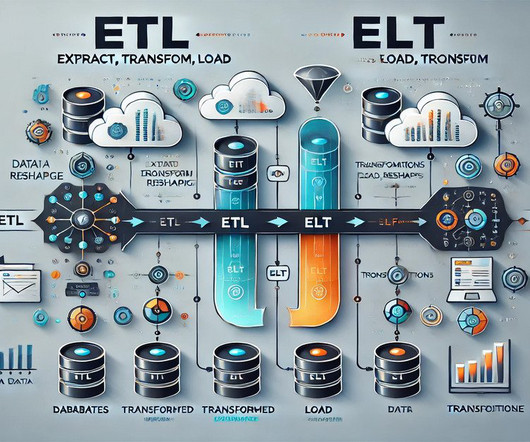
The extraction of raw data, transforming to a suitable format for business needs, and loading into a data warehouse. Data transformation. This process helps to transform raw data into cleandata that can be analysed and aggregated. Data analytics and visualisation.
Coding Skills for Data Analytics Coding is an essential skill for Data Analysts, as it enables them to manipulate, clean, and analyze data efficiently. Programming languages such as Python, R, SQL, and others are widely used in Data Analytics. Rich set of packages tailored for data manipulation and analysis.
We are living in a world where data drives decisions. Data manipulation in Data Science is the fundamental process in dataanalysis. The data professionals deploy different techniques and operations to derive valuable information from the raw and unstructured data.
” The answer: they craft predictive models that illuminate the future ( Image credit ) Data collection and cleaning : Data scientists kick off their journey by embarking on a digital excavation, unearthing raw data from the digital landscape. Interprets data to uncover actionable insights guiding business decisions.
Your journey ends here where you will learn the essential handy tips quickly and efficiently with proper explanations which will make any type of data importing journey into the Python platform super easy. Introduction Are you a Python enthusiast looking to import data into your code with ease?
Through this process, the data is made very accurate and prepared for analysis. Data wrangling prepares raw data for analysis by cleaning, converting, and manipulating it. It might be a time-consuming operation but it is a necessary stage in dataanalysis.
Individuals with data skills can find a suitable fitment in different industries. Moreover, learning it at a young age can give kids a head start in acquiring the knowledge and skills needed for future career opportunities in DataAnalysis, Machine Learning, and Artificial Intelligence.
Data scientists must decide on appropriate strategies to handle missing values, such as imputation with mean or median values or removing instances with missing data. The choice of approach depends on the impact of missing data on the overall dataset and the specific analysis or model being used.
With its intuitive interface, Power BI empowers users to connect to various data sources, create interactive reports, and share insights effortlessly. Optimising Power BI reports for performance ensures efficient dataanalysis. What is Power BI, and how does it differ from other data visualisation tools?
Data Science has also been instrumental in addressing global challenges, such as climate change and disease outbreaks. Data Science has been critical in providing insights and solutions based on DataAnalysis. Skills Required for a Data Scientist Data Science has become a cornerstone of decision-making in many industries.
Direct Query and Import: Users can import data into Power BI or create direct connections to databases for real-time dataanalysis. Data Transformation and Modeling: Power Query: This feature enables users to shape, transform, and cleandata from various sources before visualization.
Amazon SageMaker Data Wrangler is a single visual interface that reduces the time required to prepare data and perform feature engineering from weeks to minutes with the ability to select and cleandata, create features, and automate data preparation in machine learning (ML) workflows without writing any code.
It can occur in bulk, where large batches of data are uploaded at once, or incrementally, where data is loaded continuously or at scheduled intervals. A successful load ensures Analysts and decision-makers access to up-to-date, cleandata. Talend: An open-source solution that provides various data management features.
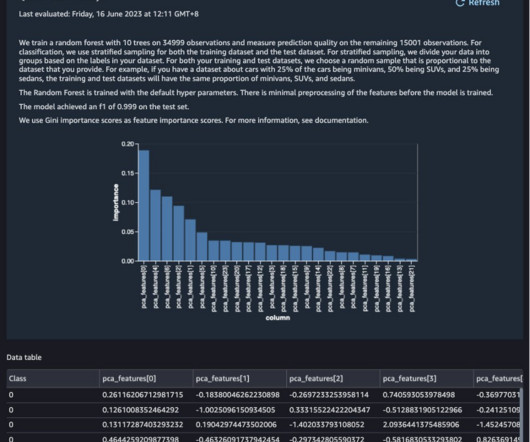
Data engineers can prepare the data by removing duplicates, dealing with outliers, standardizing data types and precision between data sets, and joining data sets together. Using this cleaneddata, our machine learning engineers can develop models to be trained and used to predict metrics such as sales.
DataCleaning: Raw data often contains errors, inconsistencies, and missing values. Datacleaning identifies and addresses these issues to ensure data quality and integrity. Data Visualisation: Effective communication of insights is crucial in Data Science.
The following figure represents the life cycle of data science. It starts with gathering the business requirements and relevant data. Once the data is acquired, it is maintained by performing datacleaning, data warehousing, data staging, and data architecture.
Here’s the structured equivalent of this same data in tabular form: With structured data, you can use query languages like SQL to extract and interpret information. In contrast, such traditional query languages struggle to interpret unstructured data. This text has a lot of information, but it is not structured.
Roles and responsibilities of a data scientist Data scientists are tasked with several important responsibilities that contribute significantly to data strategy and decision-making within an organization. Analyzing data trends: Using analytic tools to identify significant patterns and insights for business improvement.
User dataanalysis Chattermill is made for apps with tons of users, like BlaBlaCar and Uber. This service works with equations and data in spreadsheet form. But it can do what the best visualization tools do: provide conclusions, cleandata, or highlight key information. Meeting minutes from Neuroslav 3.
If youre not familiar with dplyr, imagine SQL, but more flexible andmodular. Writing R scripts to cleandata or build charts wasnt easy for many. Thats why we created Exploratory to make the power of dplyr accessible through a friendly UI that simplified data exploration and visualization.
We organize all of the trending information in your field so you don't have to. Join 17,000+ users and stay up to date on the latest articles your peers are reading.
You know about us, now we want to get to know you!
Let's personalize your content
Let's get even more personalized
We recognize your account from another site in our network, please click 'Send Email' below to continue with verifying your account and setting a password.


Let's personalize your content