This site uses cookies to improve your experience. To help us insure we adhere to various privacy regulations, please select your country/region of residence. If you do not select a country, we will assume you are from the United States. Select your Cookie Settings or view our Privacy Policy and Terms of Use.
Cookie Settings
Cookies and similar technologies are used on this website for proper function of the website, for tracking performance analytics and for marketing purposes. We and some of our third-party providers may use cookie data for various purposes. Please review the cookie settings below and choose your preference.
Used for the proper function of the website
Used for monitoring website traffic and interactions
Cookie Settings
Cookies and similar technologies are used on this website for proper function of the website, for tracking performance analytics and for marketing purposes. We and some of our third-party providers may use cookie data for various purposes. Please review the cookie settings below and choose your preference.
Strictly Necessary: Used for the proper function of the website
Performance/Analytics: Used for monitoring website traffic and interactions
ArticleVideo Book This article was published as a part of the Data Science Blogathon Introduction Data Cleansing is the process of analyzing data for finding. The post Data Cleansing: How To CleanData With Python! appeared first on Analytics Vidhya.
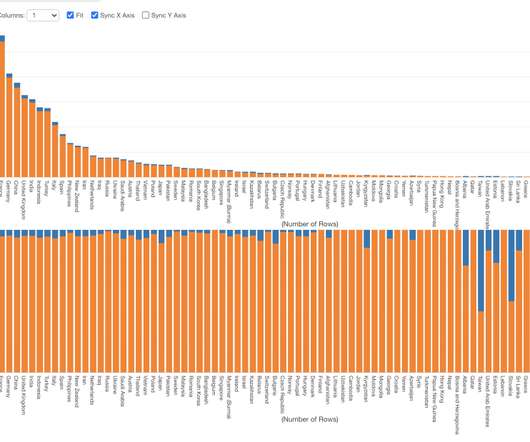
This article was published as a part of the Data Science Blogathon Image 1In this blog, We are going to talk about some of the advanced and most used charts in Plotly while doing analysis. All you need to know is Plotly for visualization! The post Performing EDA of Netflix Dataset with Plotly appeared first on Analytics Vidhya.
Google Colab, Googles cloud-based notebook tool for coding, data science, and AI, is gaining a new AI agent tool, Data Science Agent, to help Colab users quickly cleandata, visualize trends, and get insights on their uploaded data sets. First announced at Googles I/O developer conference early
Data types are a defining feature of big data as unstructured data needs to be cleaned and structured before it can be used for data analytics. In fact, the availability of cleandata is among the top challenges facing data scientists.
Summary: Data Analysis focuses on extracting meaningful insights from raw data using statistical and analytical methods, while datavisualization transforms these insights into visual formats like graphs and charts for better comprehension. Deep Dive: What is DataVisualization?
This is where a data workflow is essential, allowing you to turn your raw data into actionable insights. In this article, well explore how that workflow covering aspects from data collection to datavisualizations can tackle the real-world challenges.
Descriptive statistics Grouping and aggregating: One way to explore a dataset is by grouping the data by one or more variables, and then aggregating the data by calculating summary statistics. This can be useful for identifying patterns and trends in the data.
The final point to which the data has to be eventually transferred is a destination. The destination is decided by the use case of the data pipeline. It can be used to run analytical tools and power datavisualization as well. Otherwise, it can also be moved to a storage centre like a data warehouse or lake.
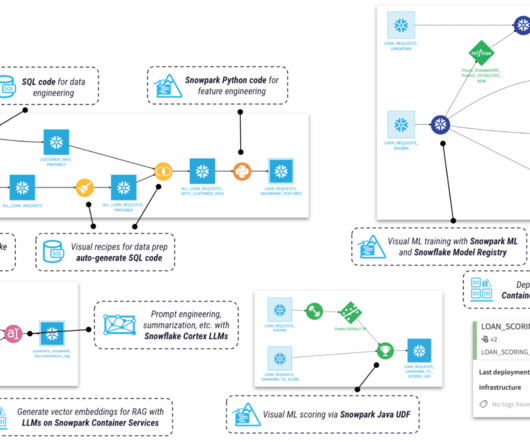
By providing a single, unified platform for data storage, management, and analysis, Snowflake connects organizations to leading software vendors specializing in analytics, machine learning, datavisualization, and more.
This article was published as a part of the Data Science Blogathon. Introduction to Data Storytelling Storytelling is a beautiful legacy that is a part of our great Indian culture, from the legendary Mahabharata era to Puranas and Jataka fables. The post The Understated Art of Data Storytelling appeared first on Analytics Vidhya.
Data scientists try multiple models, evaluate their performance, and fine-tune some parameters to get better accuracy. DataVisualization and Interpretation To make the data understandable to stakeholders, visualizations are created in the form of charts, graphs, and dashboards.
This article was published as a part of the Data Science Blogathon Introduction You must be aware of the fact that Feature Engineering is the heart of any Machine Learning model. How successful a model is or how accurately it predicts that depends on the application of various feature engineering techniques. In this article, we are […].
Introduction Data scientists spend close to 70% (if not more) of their time cleaning, massaging and preparing data. The post A Beginner’s Guide to Tidyverse – The Most Powerful Collection of R Packages for Data Science appeared first on Analytics Vidhya. That’s no secret – multiple surveys.
Introduction Effective data management is crucial for organizations of all sizes and in all industries because it helps ensure the accuracy, security, and accessibility of data, which is essential for making good decisions and operating efficiently.
Introduction Stress is a natural response of the body and mind to a demanding or challenging situation. It is the body’s way of reacting to external pressures or internal thoughts and feelings.
They employ statistical and mathematical techniques to uncover patterns, trends, and relationships within the data. Data scientists possess a deep understanding of statistical modeling, datavisualization, and exploratory data analysis to derive actionable insights and drive business decisions.
Introduction Python is a versatile and powerful programming language that plays a central role in the toolkit of data scientists and analysts. Its simplicity and readability make it a preferred choice for working with data, from the most fundamental tasks to cutting-edge artificial intelligence and machine learning.
In-depth data analysis using GPT-4’s datavisualization toolset. dallE-2: painting in impressionist style with thick oil colors of a map of Europe Efficiency is everything for coders and data analysts. With GPT-4’s Advanced Data Analysis (ADA) toolset, this process becomes significantly more streamlined.
Are you a data enthusiast looking to break into the world of analytics? The field of data science and analytics is booming, with exciting career opportunities for those with the right skills and expertise. So, let’s […] The post Data Scientist vs Data Analyst: Which is a Better Career Option to Pursue in 2023?
Let’s dive into the fascinating world of H1B visa data from the Office of Foreign Labor Certification […] The post Is H1B Visa Approved Based On The Insights Of Data Analysis? Introduction The H1B visa program opens doors for skilled individuals worldwide to bring their expertise to the United States.
Imagine data scientists as modern-day detectives who sift through a sea of information to uncover hidden patterns, trends, and correlations that can inform decision-making and drive innovation. At the heart of the matter lies the query, “What does a data scientist do?” Work Works with larger, more complex data sets.
“This partnership makes data more accessible and trusted. With Looker’s secure, trusted and highly performant data governance capabilities, we can augment Tableau’s world-class datavisualization capabilities to enable data-driven decisions across the enterprise. Operationalizing Tableau Prep flows to BigQuery.
“This partnership makes data more accessible and trusted. With Looker’s secure, trusted and highly performant data governance capabilities, we can augment Tableau’s world-class datavisualization capabilities to enable data-driven decisions across the enterprise. Operationalizing Tableau Prep flows to BigQuery.
Here, we’ll explore why Data Science is indispensable in today’s world. Understanding Data Science At its core, Data Science is all about transforming raw data into actionable information. It includes data collection, datacleaning, data analysis, and interpretation.
It has a dedicated community and numerous packages like ggplot2 for DataVisualization. Understanding DataVisualizationDatavisualization is a critical aspect of Data Science.
We also reached some incredible milestones with Tableau Prep, our easy-to-use, visual, self-service data prep product. In 2020, we added the ability to write to external databases so you can use cleandata anywhere. Tableau Prep can now be used across more use cases and directly in the browser.
Her research interest includes model interpretability, causal analysis, human-in-the-loop AI and interactive datavisualization. He has collaborated with the Amazon Machine Learning Solutions Lab in providing cleandata for them to work with as well as providing domain knowledge about the data itself.
Data Analyst Without Coding While coding skills are highly beneficial for Data Analysts, some entry-level positions may not require extensive programming knowledge. Companies often hire Data Analysts for roles that focus primarily on datavisualization, reporting, and using pre-built tools and dashboards.
Pandas is a powerful data manipulation library in Python, which we'll be using to load, transform and analyze the data. We'll also use numpy and matplotlib libraries for numerical computations and datavisualization. data = data.dropna() We can also use the drop_duplicates() method to remove duplicated rows.
Raw data often contains inconsistencies, missing values, and irrelevant features that can adversely affect the performance of Machine Learning models. Proper preprocessing helps in: Improving Model Accuracy: Cleandata leads to better predictions. Matplotlib/Seaborn: For datavisualization.
Moreover, this feature helps integrate data sets to gain a more comprehensive view or perform complex analyses. DataCleaningData manipulation provides tools to clean and preprocess data. Thus, Cleaningdata ensures data quality and enhances the accuracy of analyses.
Accordingly, Data Analysts use various tools for Data Analysis and Excel is one of the most common. Significantly, the use of Excel in Data Analysis is beneficial in keeping records of data over time and enabling datavisualization effectively. How to use Excel in Data Analysis and why is it important?
Data Wrangler simplifies the data preparation and feature engineering process, reducing the time it takes from weeks to minutes by providing a single visual interface for data scientists to select and cleandata, create features, and automate data preparation in ML workflows without writing any code.
Overview of Typical Tasks and Responsibilities in Data Science As a Data Scientist, your daily tasks and responsibilities will encompass many activities. You will collect and cleandata from multiple sources, ensuring it is suitable for analysis. DataCleaningDatacleaning is crucial for data integrity.
Key Features of Power BI: Power BI is a powerful business intelligence tool developed by Microsoft that enables users to visualize and analyze data from various sources. It offers a wide range of features that make it a popular choice for data professionals, analysts, and organizations.
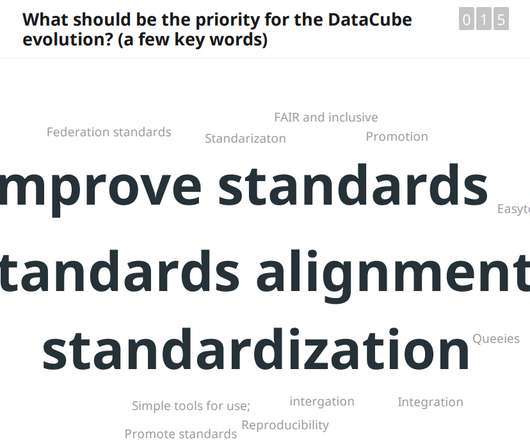
Presenters and participants had the opportunity to hear about and evaluate the pros and cons of different back end technologies and data formats for different uses such as web-mapping, datavisualization, and the sharing of meta-data. These can be cleaned to remove artifacts and/or outdated elements.
Data scientists must decide on appropriate strategies to handle missing values, such as imputation with mean or median values or removing instances with missing data. The choice of approach depends on the impact of missing data on the overall dataset and the specific analysis or model being used.
Let’s explore the dataset further by cleaningdata and creating some visualizations. The type column tells us if it is a TV show or a movie. df.isnull().sum() sum() #checking for null values.
Descriptive Analytics Projects: These projects focus on summarizing historical data to gain insights into past trends and patterns. Examples include generating reports, dashboards, and datavisualizations to understand business performance, customer behavior, or operational efficiency.
In a business environment, a Data Scientist is involved to work with multiple teams laying out the foundation for analysing data. This implies that as a Data Scientist, you would engage in collecting, analysing and cleaningdata gathered from multiple sources.
So, let me present to you an Importing Data in Python Cheat Sheet which will make your life easier. For initiating any data science project, first, you need to analyze the data. Alongside Matplotlib, a key tool for datavisualization, and NumPy, the foundational library for scientific computing upon which Pandas was constructed.
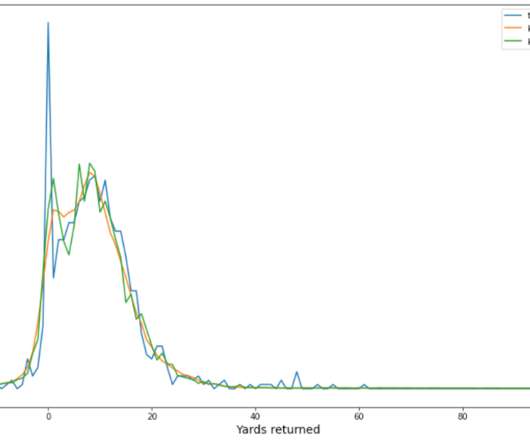
Goal The objective of this post is to demonstrate how Polars performance is much better than other open-source libraries in a variety of data analysis tasks, such as datacleaning, data wrangling, and datavisualization. ?
Text Data Wrangling UI When cleaningdata, the text data is the most notorious. We introduced the Text Data Wrangling UI with v5.5 to make the following text data wrangling operations easier. text inside of brackets) First Word / Last Word Here is an example of extracting URLs from the tweet data.
We organize all of the trending information in your field so you don't have to. Join 17,000+ users and stay up to date on the latest articles your peers are reading.
You know about us, now we want to get to know you!
Let's personalize your content
Let's get even more personalized
We recognize your account from another site in our network, please click 'Send Email' below to continue with verifying your account and setting a password.


Let's personalize your content