This site uses cookies to improve your experience. To help us insure we adhere to various privacy regulations, please select your country/region of residence. If you do not select a country, we will assume you are from the United States. Select your Cookie Settings or view our Privacy Policy and Terms of Use.
Cookie Settings
Cookies and similar technologies are used on this website for proper function of the website, for tracking performance analytics and for marketing purposes. We and some of our third-party providers may use cookie data for various purposes. Please review the cookie settings below and choose your preference.
Used for the proper function of the website
Used for monitoring website traffic and interactions
Cookie Settings
Cookies and similar technologies are used on this website for proper function of the website, for tracking performance analytics and for marketing purposes. We and some of our third-party providers may use cookie data for various purposes. Please review the cookie settings below and choose your preference.
Strictly Necessary: Used for the proper function of the website
Performance/Analytics: Used for monitoring website traffic and interactions
ArticleVideo Book This article was published as a part of the Data Science Blogathon Introduction Data Cleansing is the process of analyzing data for finding. The post Data Cleansing: How To CleanData With Python! appeared first on Analytics Vidhya.
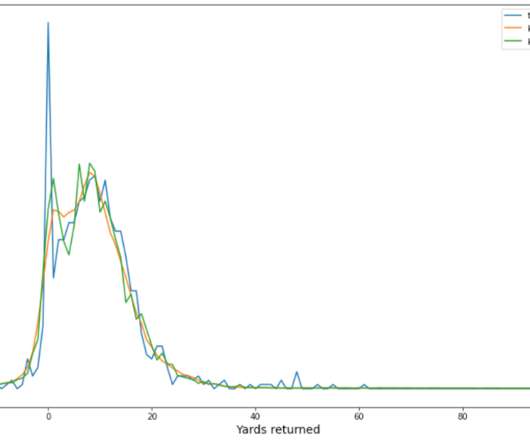
This article was published as a part of the Data Science Blogathon Image 1In this blog, We are going to talk about some of the advanced and most used charts in Plotly while doing analysis. All you need to know is Plotly for visualization! The post Performing EDA of Netflix Dataset with Plotly appeared first on Analytics Vidhya.
Introduction Python is a versatile and powerful programming language that plays a central role in the toolkit of data scientists and analysts. Its simplicity and readability make it a preferred choice for working with data, from the most fundamental tasks to cutting-edge artificial intelligence and machine learning.
Descriptive statistics Grouping and aggregating: One way to explore a dataset is by grouping the data by one or more variables, and then aggregating the data by calculating summary statistics. This can be useful for identifying patterns and trends in the data.
This is where a data workflow is essential, allowing you to turn your raw data into actionable insights. In this article, well explore how that workflow covering aspects from data collection to datavisualizations can tackle the real-world challenges.
Data can be generated from databases, sensors, social media platforms, APIs, logs, and web scraping. Data can be in structured (like tables in databases), semi-structured (like XML or JSON), or unstructured (like text, audio, and images) form.
Summary: Data Analysis focuses on extracting meaningful insights from raw data using statistical and analytical methods, while datavisualization transforms these insights into visual formats like graphs and charts for better comprehension. Deep Dive: What is DataVisualization?
Summary: Data preprocessing in Python is essential for transforming raw data into a clean, structured format suitable for analysis. It involves steps like handling missing values, normalizing data, and managing categorical features, ultimately enhancing model performance and ensuring data quality.
They employ statistical and mathematical techniques to uncover patterns, trends, and relationships within the data. Data scientists possess a deep understanding of statistical modeling, datavisualization, and exploratory data analysis to derive actionable insights and drive business decisions.
This article was published as a part of the Data Science Blogathon Introduction You must be aware of the fact that Feature Engineering is the heart of any Machine Learning model. How successful a model is or how accurately it predicts that depends on the application of various feature engineering techniques. In this article, we are […].
Raw data is processed to make it easier to analyze and interpret. Because it can swiftly and effectively handle data structures, carry out calculations, and apply algorithms, Python is the perfect language for handling data. This blog article will look at manipulating data using Python and Jupyter Notebooks.
Looking for an effective and handy Python code repository in the form of Importing Data in Python Cheat Sheet? Your journey ends here where you will learn the essential handy tips quickly and efficiently with proper explanations which will make any type of data importing journey into the Python platform super easy.
In today’s blog, we will explore the Netflix dataset using Python and uncover some interesting insights. In this blog, we’ll be using Python to perform exploratory data analysis (EDA) on a Netflix dataset that we’ve found on Kaggle. Let’s explore the dataset further by cleaningdata and creating some visualizations.
Imagine data scientists as modern-day detectives who sift through a sea of information to uncover hidden patterns, trends, and correlations that can inform decision-making and drive innovation. At the heart of the matter lies the query, “What does a data scientist do?” Work Works with larger, more complex data sets.
Understanding Data Science At its core, Data Science is all about transforming raw data into actionable information. It includes data collection, datacleaning, data analysis, and interpretation. Programming and Data Manipulation Data Scientists often work with large datasets.
Coding Skills for Data Analytics Coding is an essential skill for Data Analysts, as it enables them to manipulate, clean, and analyze data efficiently. Programming languages such as Python, R, SQL, and others are widely used in Data Analytics.
Essential Tools for Data Science To get started, you’ll need to familiarize yourself with essential tools like Python, R, and SQL. These programming languages are widely used in Data Science for data manipulation, analysis, and visualization. You can start by taking online Python courses or tutorials.
In 2020, we added the ability to write to external databases so you can use cleandata anywhere. With custom R and Python scripts, you can support any transformations and bring in predictions. More than 145,000 of you brought your passion, love, and data magic to our all-virtual Tableau Conference-ish.
GluonTS is a Python package for probabilistic time series modeling, but the SBP distribution is not specific to time series, and we were able to repurpose it for regression. Her research interest includes model interpretability, causal analysis, human-in-the-loop AI and interactive datavisualization.
These may range from Data Analytics projects for beginners to experienced ones. Following is a guide that can help you understand the types of projects and the projects involved with Python and Business Analytics. Here are some project ideas suitable for students interested in big data analytics with Python: 1.
In a business environment, a Data Scientist is involved to work with multiple teams laying out the foundation for analysing data. This implies that as a Data Scientist, you would engage in collecting, analysing and cleaningdata gathered from multiple sources.
Moreover, this feature helps integrate data sets to gain a more comprehensive view or perform complex analyses. DataCleaningData manipulation provides tools to clean and preprocess data. Thus, Cleaningdata ensures data quality and enhances the accuracy of analyses.
Goal The objective of this post is to demonstrate how Polars performance is much better than other open-source libraries in a variety of data analysis tasks, such as datacleaning, data wrangling, and datavisualization. ? It is available in multiple languages: Python, Rust, and NodeJS.
Overview of Typical Tasks and Responsibilities in Data Science As a Data Scientist, your daily tasks and responsibilities will encompass many activities. You will collect and cleandata from multiple sources, ensuring it is suitable for analysis. Must Check Out: How to Use ChatGPT APIs in Python: A Comprehensive Guide.
In 2020, we added the ability to write to external databases so you can use cleandata anywhere. With custom R and Python scripts, you can support any transformations and bring in predictions. More than 145,000 of you brought your passion, love, and data magic to our all-virtual Tableau Conference-ish.
The following figure represents the life cycle of data science. It starts with gathering the business requirements and relevant data. Once the data is acquired, it is maintained by performing datacleaning, data warehousing, data staging, and data architecture. Why is datacleaning crucial?
Do you want to be a data analyst? Data analysts are in high demand: From technology giants like IBM and Microsoft to our favorite media streaming providers like Netflix and Amazon Prime, organizations are increasingly relying on data analytics to make smart business decisions. […]. If so, great career choice!
We organize all of the trending information in your field so you don't have to. Join 17,000+ users and stay up to date on the latest articles your peers are reading.
You know about us, now we want to get to know you!
Let's personalize your content
Let's get even more personalized
We recognize your account from another site in our network, please click 'Send Email' below to continue with verifying your account and setting a password.


Let's personalize your content