This site uses cookies to improve your experience. To help us insure we adhere to various privacy regulations, please select your country/region of residence. If you do not select a country, we will assume you are from the United States. Select your Cookie Settings or view our Privacy Policy and Terms of Use.
Cookie Settings
Cookies and similar technologies are used on this website for proper function of the website, for tracking performance analytics and for marketing purposes. We and some of our third-party providers may use cookie data for various purposes. Please review the cookie settings below and choose your preference.
Used for the proper function of the website
Used for monitoring website traffic and interactions
Cookie Settings
Cookies and similar technologies are used on this website for proper function of the website, for tracking performance analytics and for marketing purposes. We and some of our third-party providers may use cookie data for various purposes. Please review the cookie settings below and choose your preference.
Strictly Necessary: Used for the proper function of the website
Performance/Analytics: Used for monitoring website traffic and interactions
Data Sources and Collection Everything in data science begins with data. Data can be generated from databases, sensors, social media platforms, APIs, logs, and web scraping. Data can be in structured (like tables in databases), semi-structured (like XML or JSON), or unstructured (like text, audio, and images) form.
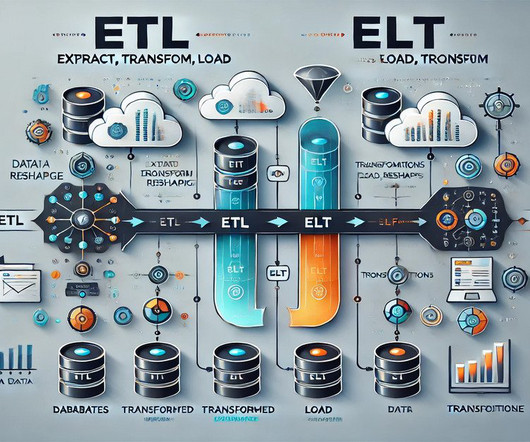
The extraction of raw data, transforming to a suitable format for business needs, and loading into a data warehouse. Data transformation. This process helps to transform raw data into cleandata that can be analysed and aggregated. Data analytics and visualisation.
Key Takeaways Big Data focuses on collecting, storing, and managing massive datasets. Data Science extracts insights and builds predictive models from processed data. Big Data technologies include Hadoop, Spark, and NoSQL databases. Data Science uses Python, R, and machine learning frameworks.
This accessible approach to data transformation ensures that teams can work cohesively on data prep tasks without needing extensive programming skills. With our cleaneddata from step one, we can now join our vehicle sensor measurements with warranty claim data to explore any correlations using data science.
We look forward to continued collaboration that will open up new opportunities for users to take their analytics to the next level in the cloud,” said Gerrit Kazmaier, Vice President & General Manager for Database, Data Analytics and Looker at Google Cloud. Your data in the cloud.
Companies that use their unstructured data most effectively will gain significant competitive advantages from AI. Cleandata is important for good model performance. Scraped data from the internet often contains a lot of duplications. Access to Amazon OpenSearch as a vector database. read HTML).
Amazon SageMaker Data Wrangler is a single visual interface that reduces the time required to prepare data and perform feature engineering from weeks to minutes with the ability to select and cleandata, create features, and automate data preparation in machine learning (ML) workflows without writing any code.
Coding Skills for Data Analytics Coding is an essential skill for Data Analysts, as it enables them to manipulate, clean, and analyze data efficiently. Programming languages such as Python, R, SQL, and others are widely used in Data Analytics. Ideal for academic and research-oriented Data Analysis.
Moreover, this feature helps integrate data sets to gain a more comprehensive view or perform complex analyses. DataCleaningData manipulation provides tools to clean and preprocess data. Thus, Cleaningdata ensures data quality and enhances the accuracy of analyses.
We look forward to continued collaboration that will open up new opportunities for users to take their analytics to the next level in the cloud,” said Gerrit Kazmaier, Vice President & General Manager for Database, Data Analytics and Looker at Google Cloud. Your data in the cloud.
So, let me present to you an Importing Data in Python Cheat Sheet which will make your life easier. For initiating any data science project, first, you need to analyze the data. In this Importing Data in Python Cheat Sheet article, we will explore the essential techniques and libraries that will make data import a breeze.
With Alation Connected Sheets, business users can browse and pull the most current, compliant data directly from cloud sources into a spreadsheet – without SQL or subject matter expert assistance. These data objects could include anything from business glossary terms, to a database table or a SQL query with helpful descriptions.
With Prep, users can easily and quickly combine, shape, and cleandata for analysis with just a few clicks. In this blog, we’ll discuss ways to make your data preparation flow run faster. These tips can be used in any of your Prep flows but will have the most impact on your flows that connect to large database tables.
With Prep, users can easily and quickly combine, shape, and cleandata for analysis with just a few clicks. In this blog, we’ll discuss ways to make your data preparation flow run faster. These tips can be used in any of your Prep flows but will have the most impact on your flows that connect to large database tables.
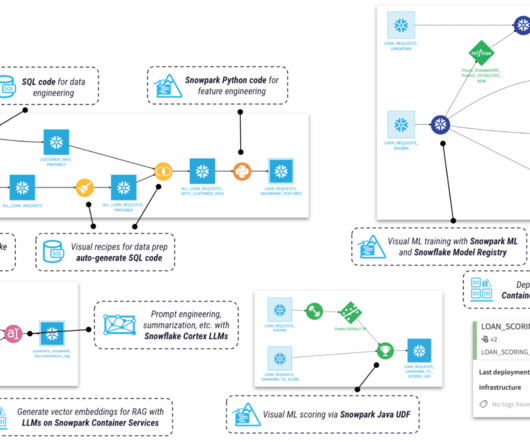
Snowpark is the set of libraries and runtimes in Snowflake that securely deploy and process non-SQL code, including Python, Java, and Scala. create() DataFrames In Snowpark, the main way in which you query and process data is through a DataFrame. A DataFrame is like a query that must be evaluated to retrieve data.
Organisations leverage diverse methods to gather data, including: Direct Data Capture: Real-time collection from sensors, devices, or web services. Database Extraction: Retrieval from structured databases using query languages like SQL. Aggregation: Summarising data into meaningful metrics or aggregates.
Programming Languages (Python, R, SQL) Proficiency in programming languages is crucial. SQL is indispensable for database management and querying. Skills in data manipulation and cleaning are necessary to prepare data for analysis. Data Visualisation Visualisation of data is a critical skill.
Python import pandas as pd import numpy as np import matplotlib.pyplot as plt Loading Data The first step in data wrangling is loading the data into a Pandas data frame. There are different ways to load data into a data frame, such as from a CSV file, an Excel file, a SQLdatabase, or a web API.
By employing ETL, businesses ensure that their data is reliable, accurate, and ready for analysis. This process is essential in environments where data originates from various systems, such as databases , applications, and web services. The key is to ensure that all relevant data is captured for further processing.
Data scientists must decide on appropriate strategies to handle missing values, such as imputation with mean or median values or removing instances with missing data. The choice of approach depends on the impact of missing data on the overall dataset and the specific analysis or model being used.
Here’s the structured equivalent of this same data in tabular form: With structured data, you can use query languages like SQL to extract and interpret information. In contrast, such traditional query languages struggle to interpret unstructured data. Examples of vector databases include Weaviate , ChromaDB , and Qdrant.
Data Connectivity: Data Source Compatibility: Power BI can connect to a diverse range of data sources including databases, cloud services, spreadsheets, web services, and more. Direct Query and Import: Users can import data into Power BI or create direct connections to databases for real-time data analysis.
Key Processes and Techniques in Data Analysis Data Collection: Gathering raw data from various sources (databases, APIs, surveys, sensors, etc.). DataCleaning & Preparation: This is often the most time-consuming step. Recommends actions to achieve desired outcomes (e.g.,
How do you load data into Power BI? Loading data into Power BI is a straightforward process. Using Power Query, users can connect to various data sources such as Excel files, SQLdatabases, or cloud services like Azure. Once connected, data can be transformed and loaded into Power BI for analysis.
Key Components of Data Science Data Science consists of several key components that work together to extract meaningful insights from data: Data Collection: This involves gathering relevant data from various sources, such as databases, APIs, and web scraping.
Sidebar Navigation: Provides a catalog sidebar for browsing resources by type, package, file tree, or database schema, reflecting the structure of both dbt projects and the data platform. Efficient Data Retrieval: Quick access to metric datasets from your data platform is made possible by MetricFlow’s optimized processes.
The following figure represents the life cycle of data science. It starts with gathering the business requirements and relevant data. Once the data is acquired, it is maintained by performing datacleaning, data warehousing, data staging, and data architecture. Why is datacleaning crucial?
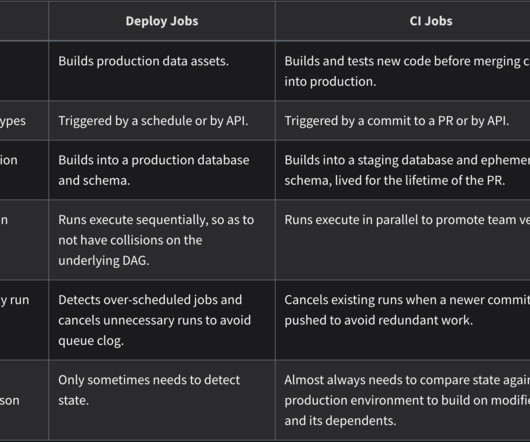
While it can be challenging to assign meaningful names to intermediate model files due to the complexity of joins and aggregations involved, best practices suggest naming the models with a format like int_<verb> sql. It is recommended that they be replaced with ref() for models and source() for raw data.
This service works with equations and data in spreadsheet form. But it can do what the best visualization tools do: provide conclusions, cleandata, or highlight key information. Writing SQL queries with SQL copilot Multiple Copilot solutions currently aid in the composition of SQL queries.
What youll do : Data wrangling is about acquiring, consolidating, and reshaping raw data into a usable form. Youll extract from APIs, query databases, and convert formats to make your dataset analysis-ready. Data Transformation: Reshaping forInsight Why it matters: Models require structured, numerical inputs.
We organize all of the trending information in your field so you don't have to. Join 17,000+ users and stay up to date on the latest articles your peers are reading.
You know about us, now we want to get to know you!
Let's personalize your content
Let's get even more personalized
We recognize your account from another site in our network, please click 'Send Email' below to continue with verifying your account and setting a password.


Let's personalize your content