This site uses cookies to improve your experience. To help us insure we adhere to various privacy regulations, please select your country/region of residence. If you do not select a country, we will assume you are from the United States. Select your Cookie Settings or view our Privacy Policy and Terms of Use.
Cookie Settings
Cookies and similar technologies are used on this website for proper function of the website, for tracking performance analytics and for marketing purposes. We and some of our third-party providers may use cookie data for various purposes. Please review the cookie settings below and choose your preference.
Used for the proper function of the website
Used for monitoring website traffic and interactions
Cookie Settings
Cookies and similar technologies are used on this website for proper function of the website, for tracking performance analytics and for marketing purposes. We and some of our third-party providers may use cookie data for various purposes. Please review the cookie settings below and choose your preference.
Strictly Necessary: Used for the proper function of the website
Performance/Analytics: Used for monitoring website traffic and interactions
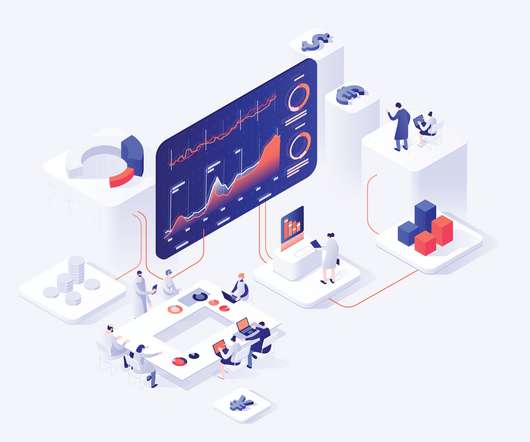
There is no disputing the fact that the collection and analysis of massive amounts of unstructured data has been a huge breakthrough. We would like to talk about datavisualization and its role in the big data movement. Data is useless without the opportunity to visualize what we are looking for.
Introduction Companies can access a large pool of data in the modern business environment, and using this data in real-time may produce insightful results that can spur corporate success. Real-time dashboards such as GCP provide strong datavisualization and actionable information for decision-makers.
Key Skills Required Knowledge of Algorithms and Predictive Models: Proficiency in using algorithms and predictive models to forecast future trends based on present data. DataVisualization Techniques: Ability to transform complex data into understandable graphs and charts. Your Next Step: Explore the Field!
Data science bootcamps are intensive short-term educational programs designed to equip individuals with the skills needed to enter or advance in the field of data science. They cover a wide range of topics, ranging from Python, R, and statistics to machine learning and datavisualization.
Introduction Are you curious about the latest advancements in the data tech industry? Perhaps you’re hoping to advance your career or transition into this field. In that case, we invite you to check out DataHour, a series of webinars led by experts in the field.
Introduction Data analytics solutions collect, process, and analyze data to extract insights and make informed business decisions. The need for a data analytics solution arises from the increasing amount of data organizations generate and the need to extract value from that data.
Basic knowledge of statistics is essential for data science. Statistics is broadly categorized into two types – Descriptive statistics – Descriptive statistics is describing the data. Visual graphs are the core of descriptive statistics. Exploratory DataAnalysis. Use cases of data science.
Navigate through 6 Popular Python Libraries for Data Science R R is another important language, particularly valued in statistics and dataanalysis, making it useful for AI applications that require intensive data processing.
Edge AI for Real-Time Decision-Making Edge AI brings AI processing capabilities to IoT devices at the network edge, reducing latency and empowering IoT devices to make real-time decisions without relying on cloudcomputing.
Scientific Computing: Use Python for scientific computing tasks, such as dataanalysis and visualization, Machine Learning, and numerical simulations. DataVisualization: Use libraries such as Matplotlib, Seaborn, Plotly, etc., to visualize and understand data and model performance.
The University of Nottingham offers a Master of Science in Bioinformatics, which is aimed at students with a background in biological sciences who wish to develop skills in bioinformatics, statistics, computer programming , and Data Analytics. Familiarise yourself with dataanalysis tools such as RStudio, Jupyter Notebook, and Excel.
Wireless networks are often used in M2M applications because they allow devices to communicate without being connected to a wired network Cloudcomputing : Cloudcomputing is used to store and process data that is collected from M2M devices.
SaaS takes advantage of cloudcomputing infrastructure and economies of scale to provide clients a more streamlined approach to adopting, using and paying for software. However, SaaS architectures can easily overwhelm DevOps teams with data aggregation, sorting and analysis tasks.
By acquiring expertise in statistical techniques, machine learning professionals can develop more advanced and sophisticated algorithms, which can lead to better outcomes in dataanalysis and prediction. Familiarity with machine learning frameworks, data structures, and algorithms is also essential.
Currently, organisations across sectors are leveraging Data Science to improve customer experiences, streamline operations, and drive strategic initiatives. A key aspect of this evolution is the increased adoption of cloudcomputing, which allows businesses to store and process vast amounts of data efficiently.
Blind 75 LeetCode Questions - LeetCode Discuss Data Manipulation and Analysis Proficiency in working with data is crucial. This includes skills in data cleaning, preprocessing, transformation, and exploratory dataanalysis (EDA).
Agents can also now interpret code to tackle complex data-driven use cases, such as dataanalysis, datavisualization, text processing, solving equations, and optimization problems. This is part of our broader commitment to provide free cloudcomputing skills training to 29 million people worldwide by 2025.
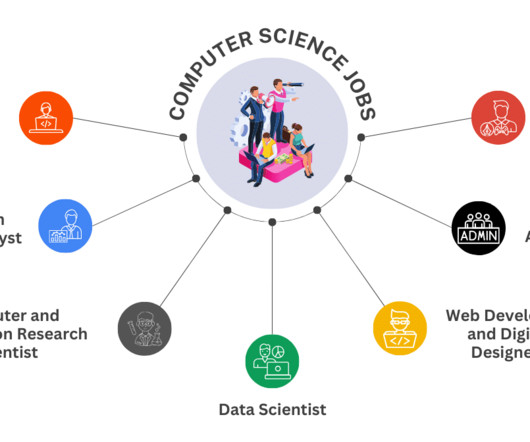
They employ statistical methods and machine learning techniques to interpret data. Key Skills Expertise in statistical analysis and datavisualization tools. Data Analyst Data Analysts gather and interpret data to help organisations make informed decisions.
Machine learning can then “learn” from the data to create insights that improve performance or inform predictions. Just as humans can learn through experience rather than merely following instructions, machines can learn by applying tools to dataanalysis.
By leveraging Azure’s capabilities, you can gain the skills and experience needed to excel in this dynamic field and contribute to cutting-edge data solutions. Microsoft Azure, often referred to as Azure, is a robust cloudcomputing platform developed by Microsoft. What is Azure?
They can automate various aspects of the research process, including: Data Collection AI tools can gather data from multiple sources such as academic journals, databases, and online repositories. This automation reduces the time researchers spend on manual data collection. What type of data do you work with?
Data Analyst: Data Analysts work with data to extract meaningful insights and support decision-making processes. They gather, clean, analyze, and visualizedata using tools like Excel, SQL, and datavisualization software. Why Pursue a Course in Data Science? Python, R).
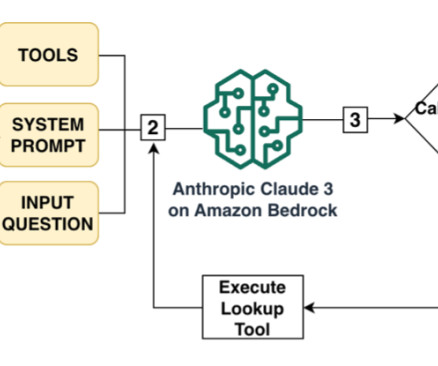
Large language models (LLMs) can help uncover insights from structured data such as a relational database management system (RDBMS) by generating complex SQL queries from natural language questions, making dataanalysis accessible to users of all skill levels and empowering organizations to make data-driven decisions faster than ever before.
We organize all of the trending information in your field so you don't have to. Join 17,000+ users and stay up to date on the latest articles your peers are reading.
You know about us, now we want to get to know you!
Let's personalize your content
Let's get even more personalized
We recognize your account from another site in our network, please click 'Send Email' below to continue with verifying your account and setting a password.


Let's personalize your content