This site uses cookies to improve your experience. To help us insure we adhere to various privacy regulations, please select your country/region of residence. If you do not select a country, we will assume you are from the United States. Select your Cookie Settings or view our Privacy Policy and Terms of Use.
Cookie Settings
Cookies and similar technologies are used on this website for proper function of the website, for tracking performance analytics and for marketing purposes. We and some of our third-party providers may use cookie data for various purposes. Please review the cookie settings below and choose your preference.
Used for the proper function of the website
Used for monitoring website traffic and interactions
Cookie Settings
Cookies and similar technologies are used on this website for proper function of the website, for tracking performance analytics and for marketing purposes. We and some of our third-party providers may use cookie data for various purposes. Please review the cookie settings below and choose your preference.
Strictly Necessary: Used for the proper function of the website
Performance/Analytics: Used for monitoring website traffic and interactions
Let’s explore each of these components and its application in the sales domain: Synapse Data Engineering: Synapse Data Engineering provides a powerful Spark platform designed for large-scale data transformations through Lakehouse. Here, we changed the data types of columns and dealt with missing values.
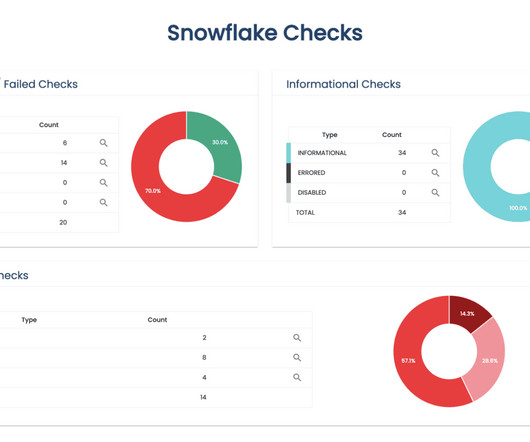
How to Optimize PowerBI and Snowflake for Advanced Analytics Spencer Baucke May 25, 2023 The world of business intelligence and data modernization has never been more competitive than it is today. Table of Contents Why Discuss Snowflake & PowerBI?
Key Features Tailored for Data Science These platforms offer specialised features to enhance productivity. Managed services like AWS Lambda and Azure Data Factory streamline datapipeline creation, while pre-built ML models in GCPs AI Hub reduce development time. Below are key strategies for achieving this.
R : Often used for statistical analysis and data visualization. Data Visualization : Techniques and tools to create visual representations of data to communicate insights effectively. Tools like Tableau, PowerBI, and Python libraries such as Matplotlib and Seaborn are commonly taught.
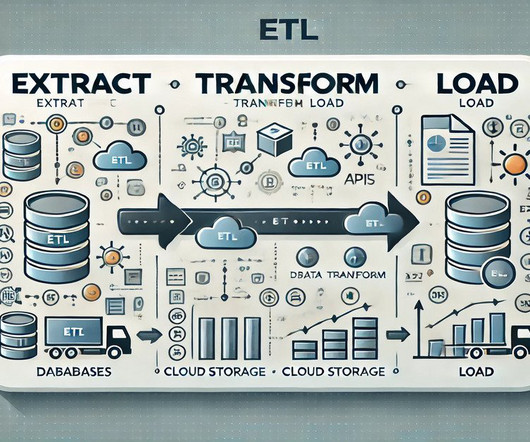
This open-source streaming platform enables the handling of high-throughput data feeds, ensuring that datapipelines are efficient, reliable, and capable of handling massive volumes of data in real-time. Its open-source nature means it’s continually evolving, thanks to contributions from its user community.
These tools are used to manage big data, which is defined as data that is too large or complex to be processed by traditional means. How Did the Modern Data Stack Get Started? The rise of cloud computing and clouddata warehousing has catalyzed the growth of the modern data stack.
However, if there’s one thing we’ve learned from years of successful clouddata implementations here at phData, it’s the importance of: Defining and implementing processes Building automation, and Performing configuration …even before you create the first user account. authorization server.
Talend Talend is a leading open-source ETL platform that offers comprehensive solutions for data integration, data quality , and clouddata management. It supports both batch and real-time data processing , making it highly versatile. It is well known for its data provenance and seamless data routing capabilities.
We organize all of the trending information in your field so you don't have to. Join 17,000+ users and stay up to date on the latest articles your peers are reading.
You know about us, now we want to get to know you!
Let's personalize your content
Let's get even more personalized
We recognize your account from another site in our network, please click 'Send Email' below to continue with verifying your account and setting a password.


Let's personalize your content