This site uses cookies to improve your experience. To help us insure we adhere to various privacy regulations, please select your country/region of residence. If you do not select a country, we will assume you are from the United States. Select your Cookie Settings or view our Privacy Policy and Terms of Use.
Cookie Settings
Cookies and similar technologies are used on this website for proper function of the website, for tracking performance analytics and for marketing purposes. We and some of our third-party providers may use cookie data for various purposes. Please review the cookie settings below and choose your preference.
Used for the proper function of the website
Used for monitoring website traffic and interactions
Cookie Settings
Cookies and similar technologies are used on this website for proper function of the website, for tracking performance analytics and for marketing purposes. We and some of our third-party providers may use cookie data for various purposes. Please review the cookie settings below and choose your preference.
Strictly Necessary: Used for the proper function of the website
Performance/Analytics: Used for monitoring website traffic and interactions
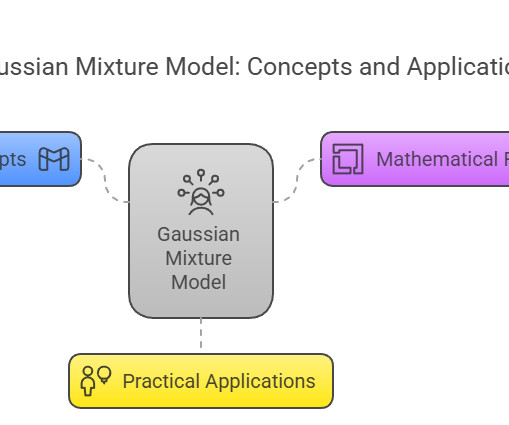
Summary: The Gaussian Mixture Model (GMM) is a flexible probabilistic model that represents data as a mixture of multiple Gaussian distributions. It excels in soft clustering, handling overlapping clusters, and modelling diverse cluster shapes. EM algorithm iteratively optimizes GMM parameters for best data fit.
These methods analyze data without pre-labeled outcomes, focusing on discovering patterns and relationships. They often play a crucial role in clustering and segmenting data, helping businesses identify trends without prior knowledge of the outcome. Well-prepared data is essential for developing robust predictive models.
DataScientists are highly in demand across different industries for making use of the large volumes of data for analysisng and interpretation and enabling effective decision making. One of the most effective programming languages used by DataScientists is R, that helps them to conduct data analysis and make future predictions.
Scikit-learn stands out as a prominent Python library in the machine learning realm, providing a versatile toolkit for datascientists and enthusiasts alike. These include: Clustering techniques: Methods like KMeans organize unlabeled data into meaningful clusters. What is Scikit-learn?
Final Stage Overall Prizes where models were rigorously evaluated with cross-validation and model reports were judged by a panel of experts. The cross-validations for all winners were reproduced by the DrivenData team. Lower is better. Unsurprisingly, the 0.10 quantile was easier to predict than the 0.90
Datascientists train multiple ML algorithms to examine millions of consumer data records, identify anomalies, and evaluate if a person is eligible for credit. This is a common problem that datascientists face when training their models.
Moreover, they require a pre-determined number of topics, which was hard to determine in our data set. The approach uses three sequential BERTopic models to generate the final clustering in a hierarchical method. In this scenario, input data comes from various areas and is usually inputted manually.
Clustering Metrics Clustering is an unsupervised learning technique where data points are grouped into clusters based on their similarities or proximity. Evaluation metrics include: Silhouette Coefficient - Measures the compactness and separation of clusters.
By selecting MLOps tools that address these vital aspects, you will create a continuous cycle from datascientists to deployment engineers to deploy models quickly without sacrificing quality. Examples include: Cross-validation techniques for better model evaluation.
Data Science interviews are pivotal moments in the career trajectory of any aspiring datascientist. Having the knowledge about the data science interview questions will help you crack the interview. Clustering algorithms such as K-means and hierarchical clustering are examples of unsupervised learning techniques.
Python facilitates the application of various unsupervised algorithms for clustering and dimensionality reduction. K-Means Clustering K-means partition data points into K clusters based on similarities in feature space.
Unsupervised Learning Unsupervised learning involves training models on data without labels, where the system tries to find hidden patterns or structures. This type of learning is used when labelled data is scarce or unavailable. It’s often used in customer segmentation and anomaly detection.
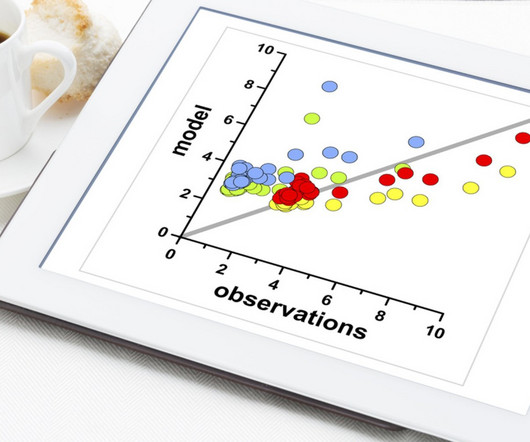
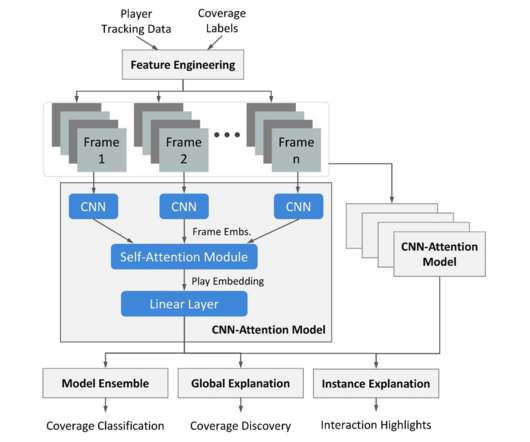
Quantitative evaluation We utilize 2018–2020 season data for model training and validation, and 2021 season data for model evaluation. As an example, in the following figure, we separate Cover 3 Zone (green cluster on the left) and Cover 1 Man (blue cluster in the middle).
Big Data Technologies and Tools A comprehensive syllabus should introduce students to the key technologies and tools used in Big Data analytics. Some of the most notable technologies include: Hadoop An open-source framework that allows for distributed storage and processing of large datasets across clusters of computers.
Using built-in automation workflows , either through the no-code Graphical User Interface (GUI) or the code-centric DataRobot for datascientists , both datascientists and non-datascientists—such as asset managers and investment analysts—can build, evaluate, understand, explain, and deploy their own models.
Data Science is the art and science of extracting valuable information from data. It encompasses data collection, cleaning, analysis, and interpretation to uncover patterns, trends, and insights that can drive decision-making and innovation.
Their work environments are typically collaborative, involving teamwork with DataScientists, software engineers, and product managers. Tools like pandas and SQL help manipulate and query data , while libraries such as matplotlib and Seaborn are used for data visualisation. accuracy, precision, recall, F1-score).
UnSupervised Learning Unlike Supervised Learning, unSupervised Learning works with unlabeled data. The algorithm tries to find hidden patterns or groupings in the data. Clustering and dimensionality reduction are common tasks in unSupervised Learning. For a regression problem (e.g., For unSupervised Learning tasks (e.g.,
Although MLOps is an abbreviation for ML and operations, don’t let it confuse you as it can allow collaborations among datascientists, DevOps engineers, and IT teams. Model Training Frameworks This stage involves the process of creating and optimizing the predictive models with labeled and unlabeled data.
Hey guys, in this blog we will see some of the most asked Data Science Interview Questions by interviewers in [year]. Data science has become an integral part of many industries, and as a result, the demand for skilled datascientists is soaring. What is Cross-Validation?
Overfitting occurs when a model learns the training data too well, including noise and irrelevant patterns, leading to poor performance on unseen data. Techniques such as cross-validation, regularisation , and feature selection can prevent overfitting. Data Analytics Certification Course by Pickl.AI
Projecting data into two or three dimensions reveals hidden structures and clusters, particularly in large, unstructured datasets. Feature Encoding Machine Learning models require numerical inputs, but real-world datasets often include categorical data. Adopt an Iterative Approach Feature extraction is rarely a one-time process.
The final sub-models use broad semantic clustering, an ensemble of the provided acoustic features, a Whisper classification fine-tune, and a contrastive Whisper fine-tune, designed to focus the model on identifying features independent of age, gender, and semantic group. Cluster 0 was in English and included many people talking to an Alexa.
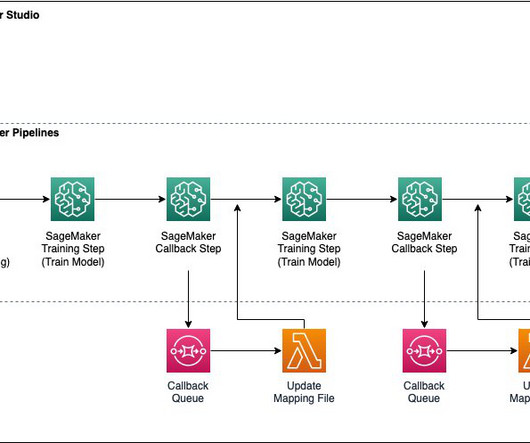
The pipeline automates the entire process of preprocessing the data and training the model, making the workflow more efficient and easier to maintain. Perform cross-validation using StratifiedKFold. The model is trained K times, using K-1 folds for training and one fold for validation.
We organize all of the trending information in your field so you don't have to. Join 17,000+ users and stay up to date on the latest articles your peers are reading.
You know about us, now we want to get to know you!
Let's personalize your content
Let's get even more personalized
We recognize your account from another site in our network, please click 'Send Email' below to continue with verifying your account and setting a password.


Let's personalize your content