This site uses cookies to improve your experience. To help us insure we adhere to various privacy regulations, please select your country/region of residence. If you do not select a country, we will assume you are from the United States. Select your Cookie Settings or view our Privacy Policy and Terms of Use.
Cookie Settings
Cookies and similar technologies are used on this website for proper function of the website, for tracking performance analytics and for marketing purposes. We and some of our third-party providers may use cookie data for various purposes. Please review the cookie settings below and choose your preference.
Used for the proper function of the website
Used for monitoring website traffic and interactions
Cookie Settings
Cookies and similar technologies are used on this website for proper function of the website, for tracking performance analytics and for marketing purposes. We and some of our third-party providers may use cookie data for various purposes. Please review the cookie settings below and choose your preference.
Strictly Necessary: Used for the proper function of the website
Performance/Analytics: Used for monitoring website traffic and interactions
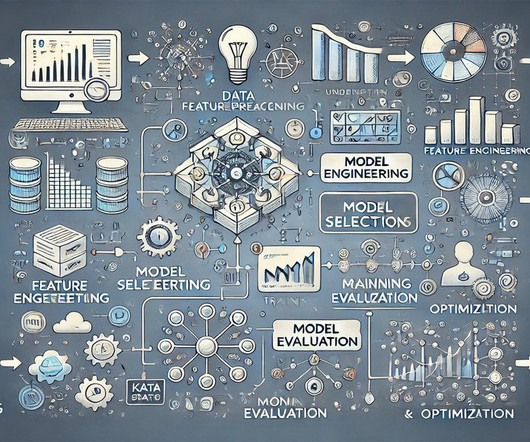
By utilizing algorithms and statistical models, data mining transforms raw data into actionable insights. The data mining process The data mining process is structured into four primary stages: data gathering, data preparation, data mining, and dataanalysis and interpretation.
decisiontrees, support vector regression) that can model even more intricate relationships between features and the target variable. Support Vector Machines (SVM): This algorithm finds a hyperplane that best separates data points of different classes in high-dimensional space. shirt, pants).
Unsupervised models Unsupervised models typically use traditional statistical methods such as logistic regression, time series analysis, and decisiontrees. These methods analyze data without pre-labeled outcomes, focusing on discovering patterns and relationships.
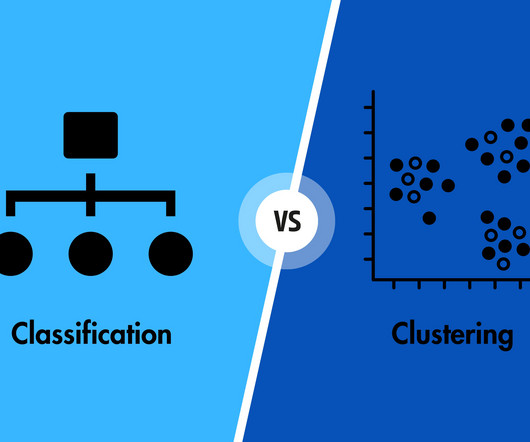
ML algorithms fall into various categories which can be generally characterised as Regression, Clustering, and Classification. While Classification is an example of directed Machine Learning technique, Clustering is an unsupervised Machine Learning algorithm. Consequently, each brand of the decisiontree will yield a distinct result.
It provides a fast and efficient way to manipulate data arrays. Pandas is a library for dataanalysis. It provides a high-level interface for working with data frames. Matplotlib is a library for plotting data. Decisiontrees are used to classify data into different categories.
Summary: DataAnalysis focuses on extracting meaningful insights from raw data using statistical and analytical methods, while data visualization transforms these insights into visual formats like graphs and charts for better comprehension. Is DataAnalysis just about crunching numbers?
Summary: The Data Science and DataAnalysis life cycles are systematic processes crucial for uncovering insights from raw data. From acquisition to interpretation, these cycles guide decision-making, drive innovation, and enhance operational efficiency. billion INR by 2026, with a CAGR of 27.7%.
From predicting patient outcomes to optimizing inventory management, these techniques empower decision-makers to navigate data landscapes confidently, fostering informed and strategic decision-making. It is a mathematical framework that aims to capture the underlying patterns, trends, and structures present in the data.
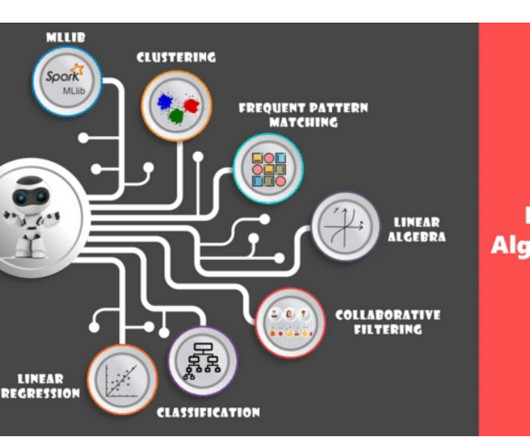
using PySpark we can run applications parallelly on the distributed cluster… blog.devgenius.io Pyspark MLlib is a wrapper over PySpark Core to do dataanalysis using machine-learning algorithms. We can find implementations of classification, clustering, linear regression, and other machine-learning algorithms in PySpark MLlib.
Naïve Bayes algorithms include decisiontrees , which can actually accommodate both regression and classification algorithms. Random forest algorithms —predict a value or category by combining the results from a number of decisiontrees.
Introduction Are you struggling to decide between data-driven practices and AI-driven strategies for your business? Besides, there is a balance between the precision of traditional dataanalysis and the innovative potential of explainable artificial intelligence.
In this era of information overload, utilizing the power of data and technology has become paramount to drive effective decision-making. Decision intelligence is an innovative approach that blends the realms of dataanalysis, artificial intelligence, and human judgment to empower businesses with actionable insights.
A sector that is currently being influenced by machine learning is the geospatial sector, through well-crafted algorithms that improve dataanalysis through mapping techniques such as image classification, object detection, spatial clustering, and predictive modeling, revolutionizing how we understand and interact with geographic information.
Here are some ways AI enhances IoT devices: Advanced dataanalysis AI algorithms can process and analyze vast volumes of IoT-generated data. By leveraging techniques like machine learning and deep learning, IoT devices can identify trends, anomalies, and patterns within the data.
Significantly, Supervised Learning is practical in two types of tasks- Classification: the goal is to predict a categorical label for each input data point Regression: the goal is to predict a continuous value. Significantly, there are two types of Unsupervised Learning: Clustering: which involves grouping similar data points together.
Summary: Statistical Modeling is essential for DataAnalysis, helping organisations predict outcomes and understand relationships between variables. It encompasses various models and techniques, applicable across industries like finance and healthcare, to drive informed decision-making.
Machine learning algorithms for unstructured data include: K-means: This algorithm is a data visualization technique that processes data points through a mathematical equation with the intention of clustering similar data points.
Scikit-learn: A simple and efficient tool for data mining and dataanalysis, particularly for building and evaluating machine learning models. Data Normalization and Standardization: Scaling numerical data to a standard range to ensure fairness in model training.
How could machine learning be used in network traffic analysis? Machine learning is fundamentally changing the landscape of network traffic analysis by automating the process of dataanalysis and interpretation.
Big DataAnalysis with PySpark Bharti Motwani | Associate Professor | University of Maryland, USA Ideal for business analysts, this session will provide practical examples of how to use PySpark to solve business problems. Finally, you’ll discuss a stack that offers an improved UX that frees up time for tasks that matter.
As a programming language it provides objects, operators and functions allowing you to explore, model and visualise data. The programming language can handle Big Data and perform effective dataanalysis and statistical modelling. R’s workflow support enhances productivity and collaboration among data scientists.
Top 50+ Interview Questions for Data Analysts Technical Questions SQL Queries What is SQL, and why is it necessary for dataanalysis? SQL stands for Structured Query Language, essential for querying and manipulating data stored in relational databases. What are the advantages and disadvantages of decisiontrees ?
Data Cleaning: Raw data often contains errors, inconsistencies, and missing values. Data cleaning identifies and addresses these issues to ensure data quality and integrity. Data Visualisation: Effective communication of insights is crucial in Data Science.
In today’s data-driven world, industries across the board are turning to advanced tools and technologies to gain deeper insights and improve their decision-making processes. This is particularly true in the financial services sector, where accurate, real-time dataanalysis can be the key to success.
UnSupervised Learning Unlike Supervised Learning, unSupervised Learning works with unlabeled data. The algorithm tries to find hidden patterns or groupings in the data. Clustering and dimensionality reduction are common tasks in unSupervised Learning. Decisiontrees are easy to interpret but prone to overfitting.
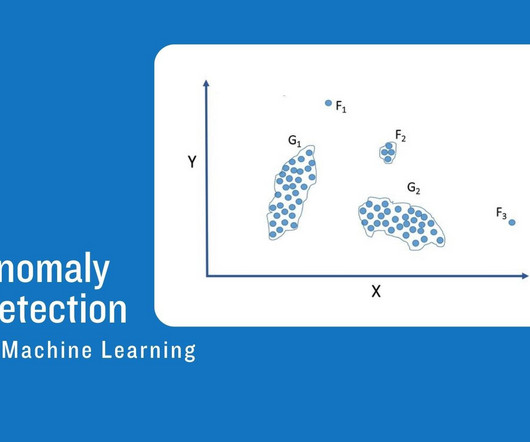
Anomaly Detection in Machine Learning: An approach to dataanalysis and Machine Learning called “anomaly detection,” also referred to as “outlier detection,” focuses on finding data points or patterns that considerably differ from what is considered to be “normal” or anticipated behaviour.
Statistical Concepts A strong understanding of statistical concepts, including probability, hypothesis testing, regression analysis, and experimental design, is paramount in Data Science roles. Clustering algorithms such as K-means and hierarchical clustering are examples of unsupervised learning techniques.
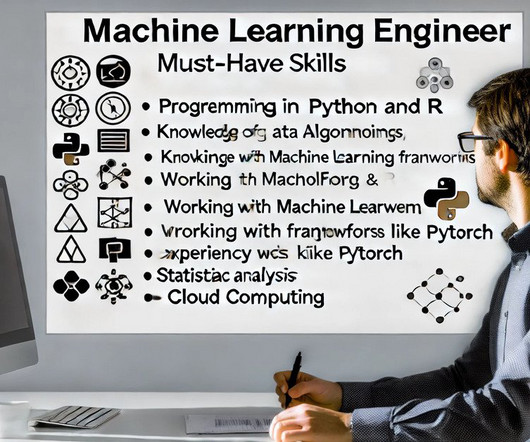
Companies can tailor products and services to individual preferences based on extensive DataAnalysis. Machine Learning Expertise Familiarity with a range of Machine Learning algorithms is crucial for Data Science practitioners. Personalisation at Scale AI will enable hyper-personalization in marketing strategies.
The following Venn diagram depicts the difference between data science and data analytics clearly: 3. Dataanalysis can not be done on a whole volume of data at a time especially when it involves larger datasets. Overfitting: The model performs well only for the sample training data.
Unsupervised Learning Unsupervised learning involves training the algorithm on unlabeled data. The goal is to uncover hidden patterns or structures in the data. Clustering and anomaly detection are examples of unsupervised learning tasks. Its ability to learn from large volumes of data makes it ideal for complex applications.
DecisionTrees These trees split data into branches based on feature values, providing clear decision rules. Unsupervised Learning Unsupervised learning involves training models on data without labels, where the system tries to find hidden patterns or structures.
While it may not be a traditional programming language, SQL plays a crucial role in Data Science by enabling efficient querying and extraction of data from databases. SQL’s powerful functionalities help in extracting and transforming data from various sources, thus helping in accurate dataanalysis.
Summary: The blog explores the synergy between Artificial Intelligence (AI) and Data Science, highlighting their complementary roles in DataAnalysis and intelligent decision-making. These components solve complex problems and drive decision-making in various industries.
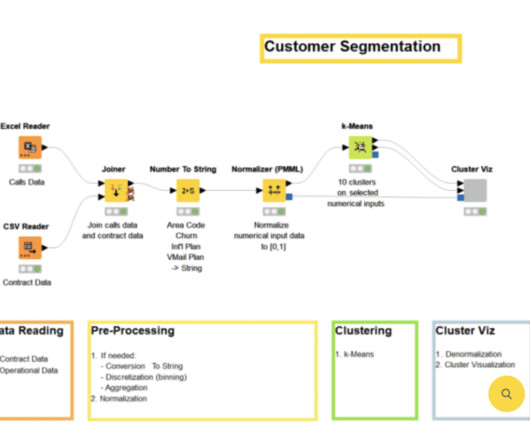
In a typical MLOps project, similar scheduling is essential to handle new data and track model performance continuously. Load and Explore Data We load the Telco Customer Churn dataset and perform exploratory dataanalysis (EDA). Are there clusters of customers with different spending patterns? #3.
Scikit-learn Scikit-learn is a machine learning library in Python that is majorly used for data mining and dataanalysis. It offers implementations of various machine learning algorithms, including linear and logistic regression , decisiontrees , random forests , support vector machines , clustering algorithms , and more.
LIME can help improve model transparency, build trust, and ensure that models make fair and unbiased decisions by identifying the key features that are more relevant in prediction-making. LIME provides explanations for individual predictions by approximating the model locally with an interpretable model like a decisiontree.
– An effective tool in clustering and classification tasks, enhancing the performance of group analysis. In machine learning: – Improves decisiontree algorithms, particularly in the node-splitting phase, adding precision to predictions.
We organize all of the trending information in your field so you don't have to. Join 17,000+ users and stay up to date on the latest articles your peers are reading.
You know about us, now we want to get to know you!
Let's personalize your content
Let's get even more personalized
We recognize your account from another site in our network, please click 'Send Email' below to continue with verifying your account and setting a password.


Let's personalize your content