This site uses cookies to improve your experience. To help us insure we adhere to various privacy regulations, please select your country/region of residence. If you do not select a country, we will assume you are from the United States. Select your Cookie Settings or view our Privacy Policy and Terms of Use.
Cookie Settings
Cookies and similar technologies are used on this website for proper function of the website, for tracking performance analytics and for marketing purposes. We and some of our third-party providers may use cookie data for various purposes. Please review the cookie settings below and choose your preference.
Used for the proper function of the website
Used for monitoring website traffic and interactions
Cookie Settings
Cookies and similar technologies are used on this website for proper function of the website, for tracking performance analytics and for marketing purposes. We and some of our third-party providers may use cookie data for various purposes. Please review the cookie settings below and choose your preference.
Strictly Necessary: Used for the proper function of the website
Performance/Analytics: Used for monitoring website traffic and interactions
Zheng’s “Guide to Data Structures and Algorithms” Parts 1 and Part 2 1) Big O Notation 2) Search 3) Sort 3)–i)–Quicksort 3)–ii–Mergesort 4) Stack 5) Queue 6) Array 7) Hash Table 8) Graph 9) Tree (e.g.,
Support Vector Machines (SVM): This algorithm finds a hyperplane that best separates data points of different classes in high-dimensional space. Decision Trees: These work by asking a series of yes/no questions based on data features to classify data points. Points far away from others are considered anomalies. shirt, pants).
By utilizing algorithms and statistical models, data mining transforms raw data into actionable insights. The data mining process The data mining process is structured into four primary stages: data gathering, data preparation, data mining, and dataanalysis and interpretation.
Cohort analysis in research Grouping patients with similar characteristics facilitates targeted research efforts, leading to faster breakthroughs in disease understanding and treatment development. Exploring Disease Mechanisms : Vector databases facilitate the identification of patient clusters that share similar disease progression patterns.
A sector that is currently being influenced by machine learning is the geospatial sector, through well-crafted algorithms that improve dataanalysis through mapping techniques such as image classification, object detection, spatial clustering, and predictive modeling, revolutionizing how we understand and interact with geographic information.
Home Table of Contents Credit Card Fraud Detection Using Spectral Clustering Understanding Anomaly Detection: Concepts, Types and Algorithms What Is Anomaly Detection? By leveraging anomaly detection, we can uncover hidden irregularities in transaction data that may indicate fraudulent behavior.
Classification algorithms —predict categorical output variables (e.g., “junk” or “not junk”) by labeling pieces of input data. Classification algorithms include logistic regression, k-nearestneighbors and support vector machines (SVMs), among others.
Therefore, it mainly deals with unlabelled data. The ability of unsupervised learning to discover similarities and differences in data makes it ideal for conducting exploratory dataanalysis. There are different kinds of unsupervised learning algorithms, including clustering, anomaly detection, neural networks, etc.
Common machine learning algorithms for supervised learning include: K-nearestneighbor (KNN) algorithm : This algorithm is a density-based classifier or regression modeling tool used for anomaly detection. Regression modeling is a statistical tool used to find the relationship between labeled data and variable data.
By the end of the lesson, readers will have a solid grasp of the underlying principles that enable these applications to make suggestions based on dataanalysis. Figure 7: TF-IDF calculation (source: Towards Data Science ). Figure 8: K-nearestneighbor algorithm (source: Towards Data Science ).
Its internal deployment strengthens our leadership in developing dataanalysis, homologation, and vehicle engineering solutions. Instead of treating each input as entirely unique, we can use a distance-based approach like k-nearestneighbors (k-NN) to assign a class based on the most similar examples surrounding the input.
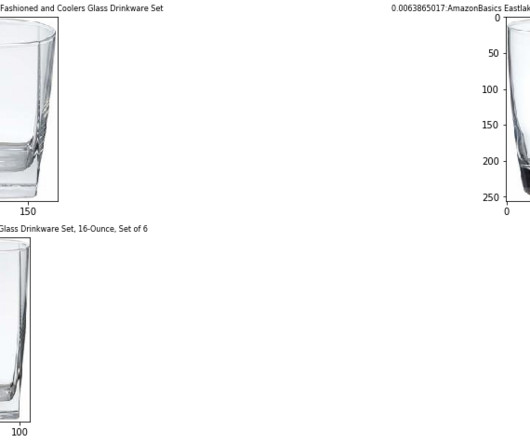
You use pandas to load the metadata, then select products that have US English titles from the data frame. Pandas is an open-source dataanalysis and manipulation tool built on top of the Python programming language. Set up the OpenSearch Service domain using k-NN settings Earlier, you created an OpenSearch cluster.
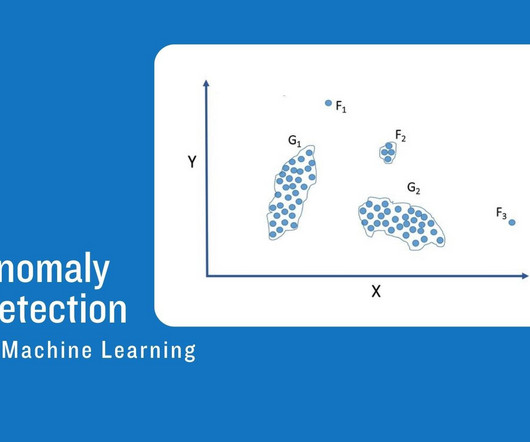
Anomaly Detection in Machine Learning: An approach to dataanalysis and Machine Learning called “anomaly detection,” also referred to as “outlier detection,” focuses on finding data points or patterns that considerably differ from what is considered to be “normal” or anticipated behaviour.
The sub-categories of this approach are negative sampling, clustering, knowledge distillation, and redundancy reduction. Some common quantitative evaluations are linear probing , Knearestneighbors (KNN), and fine-tuning. Multi-modal/temporal data is one of the important aspects of remote sensing and deep learning.
Data Cleaning: Raw data often contains errors, inconsistencies, and missing values. Data cleaning identifies and addresses these issues to ensure data quality and integrity. Data Visualisation: Effective communication of insights is crucial in Data Science.
UnSupervised Learning Unlike Supervised Learning, unSupervised Learning works with unlabeled data. The algorithm tries to find hidden patterns or groupings in the data. Clustering and dimensionality reduction are common tasks in unSupervised Learning. K-NearestNeighbors), while others can handle large datasets efficiently (e.g.,
The following Venn diagram depicts the difference between data science and data analytics clearly: 3. Dataanalysis can not be done on a whole volume of data at a time especially when it involves larger datasets. The K-NearestNeighbor Algorithm is a good example of an algorithm with low bias and high variance.
We organize all of the trending information in your field so you don't have to. Join 17,000+ users and stay up to date on the latest articles your peers are reading.
You know about us, now we want to get to know you!
Let's personalize your content
Let's get even more personalized
We recognize your account from another site in our network, please click 'Send Email' below to continue with verifying your account and setting a password.


Let's personalize your content