This site uses cookies to improve your experience. To help us insure we adhere to various privacy regulations, please select your country/region of residence. If you do not select a country, we will assume you are from the United States. Select your Cookie Settings or view our Privacy Policy and Terms of Use.
Cookie Settings
Cookies and similar technologies are used on this website for proper function of the website, for tracking performance analytics and for marketing purposes. We and some of our third-party providers may use cookie data for various purposes. Please review the cookie settings below and choose your preference.
Used for the proper function of the website
Used for monitoring website traffic and interactions
Cookie Settings
Cookies and similar technologies are used on this website for proper function of the website, for tracking performance analytics and for marketing purposes. We and some of our third-party providers may use cookie data for various purposes. Please review the cookie settings below and choose your preference.
Strictly Necessary: Used for the proper function of the website
Performance/Analytics: Used for monitoring website traffic and interactions
Are you interested in learning more about the essential skills for dataanalysts to succeed in today’s data-driven world? The good news is that you don’t need to be an engineer, scientist, or programmer to acquire the necessary data analysis skills. Who are dataanalysts?
Are DataAnalysts in Demand in 2023? The world is generating more data than ever before. This data is being generated by everything from our smartphones to our smart homes to our cars As the amount of data grows, so does the need for dataanalysts.
The career of a DataAnalyst is highly lucrative today and with the right skills, your dream job is just around the corner. It is expected that the Data Science market will have more than 11 million job roles in India by 2030, opening up opportunities for you. How to build a DataAnalyst Portfolio?
This comprehensive blog outlines vital aspects of DataAnalyst interviews, offering insights into technical, behavioural, and industry-specific questions. It covers essential topics such as SQL queries, data visualization, statistical analysis, machine learning concepts, and data manipulation techniques.
Machine learning Machine learning is a key part of data science. It involves developing algorithms that can learn from and make predictions or decisions based on data. Familiarity with regression techniques, decision trees, clustering, neural networks, and other data-driven problem-solving methods is vital.
Summary : This article equips DataAnalysts with a solid foundation of key Data Science terms, from A to Z. Introduction In the rapidly evolving field of Data Science, understanding key terminology is crucial for DataAnalysts to communicate effectively, collaborate effectively, and drive data-driven projects.
In contrast, horizontal scaling involves distributing the workload across multiple servers or nodes, commonly known as clustering. This load balancing allows RDBMS to handle increased data volumes, enabling parallel processing and faster query execution.
This blog lists down-trending data science, analytics, and engineering GitHub repositories that can help you with learning data science to build your own portfolio. What is GitHub? GitHub is a powerful platform for data scientists, dataanalysts, data engineers, Python and R developers, and more.
Scikit-learn can be used for a variety of data analysis tasks, including: Classification Regression Clustering Dimensionality reduction Feature selection Leveraging Scikit-learn in data analysis projects Scikit-learn can be used in a variety of data analysis projects. It is easy to learn and use, even for beginners.
Analyze the obtained sample data. Cluster Sampling Definition and applications Cluster sampling involves dividing a population into clusters or groups and selecting entire clusters at random for inclusion in the sample. Select clusters randomly from the population. Analyze the obtained sample data.
How Clustering Can Help You Understand Your Customers Better Customer segmentation is crucial for businesses to better understand their customers, target marketing efforts, and improve satisfaction. Clustering, a popular machine learning technique, identifies patterns in large datasets to group similar customers and gain insights.
With a range of role types available, how do you find the perfect balance of Data Scientists , Data Engineers and DataAnalysts to include in your team? The DataAnalyst Asking the right questions is often the toughest part in a data science project.
For current and future software development companies that want to be knowledgeable about using data and analysis, a few big data skillsets will help give them leverage in the coming year. Big Data Skillsets. From artificial intelligence and machine learning to blockchains and data analytics, big data is everywhere.
Summary: Python simplicity, extensive libraries like Pandas and Scikit-learn, and strong community support make it a powerhouse in Data Analysis. It excels in data cleaning, visualisation, statistical analysis, and Machine Learning, making it a must-know tool for DataAnalysts and scientists.
It is used to classify different data in different classes. Classification is similar to clustering in a way that it also segments data records into different segments called classes. But unlike clustering, here the dataanalysts would have the knowledge of different classes or cluster.
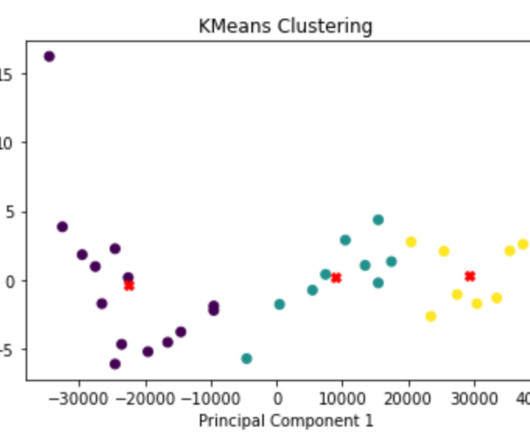
A Complete Guide about K-Means, K-Means ++, K-Medoids & PAM’s in K-Means Clustering. A Complete Guide about K-Means, K-Means ++, K-Medoids & PAM’s in K-Means Clustering. To address such tasks and uncover behavioral patterns, we turn to a powerful technique in Machine Learning called Clustering. K = 3 ; 3 Clusters.
Supervised learning Supervised learning techniques use real-world input and output data to detect anomalies. These types of anomaly detection systems require a dataanalyst to label data points as either normal or abnormal to be used as training data.
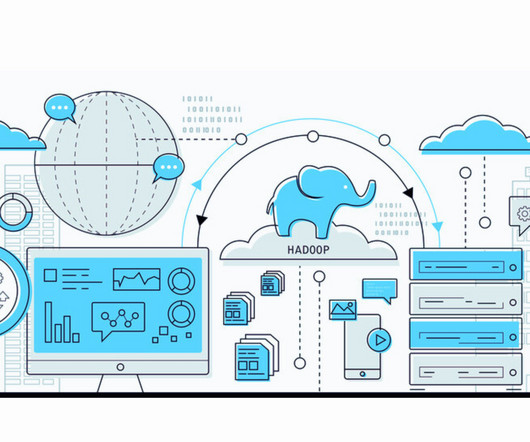
Hadoop is a framework that makes use of distributed storage and parallel processing in order to store and manage big data. DataAnalysts are the professionals who make use of the software to handle big data. It allows organizations to store and process massive amounts of data across a cluster of commodity hardware.
R is an open-source software best known for statistics and computation, while Python is more of a general-purpose programming language that you may use for plenty of tasks, thus geospatial professionals, statisticians and dataanalysts often prefer R for its robust features.
Customer Segmentation using K-Means Clustering One of the most crucial uses of data science is customer segmentation. You will need to use the K-clustering method for this GitHub data mining project. This renowned unsupervised machine learning approach splits data into K clusters based on similarities.
More like data centers, cloud platforms perform several services, including cloud storage, computation, cluster management, and data processing. Data engineering, like any other career, is a field that is constantly changing. Should You Become a Data Engineer? Follow Industry Trends. and globally.
Unfolding the difference between data engineer, data scientist, and dataanalyst. Data engineers are essential professionals responsible for designing, constructing, and maintaining an organization’s data infrastructure. These models may include regression, classification, clustering, and more.
Classification: This technique is used to classify data or groups based on specific attributes. Clustering: This technique groups data points into clusters based on similarity. Accordingly, you can opt for the Dabbler course for Data Science professionals online if you’re an aspiring DataAnalyst.
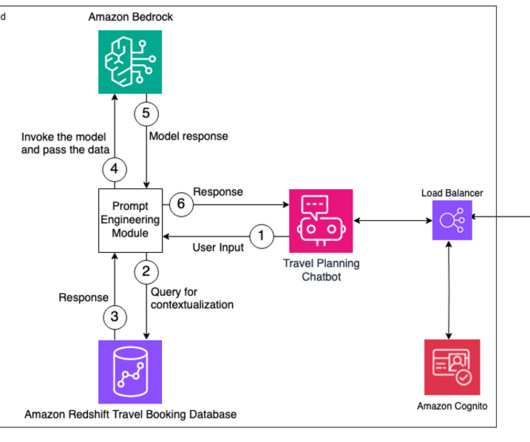
Amazon Redshift has announced a feature called Amazon Redshift ML that makes it straightforward for dataanalysts and database developers to create, train, and apply machine learning (ML) models using familiar SQL commands in Redshift data warehouses. It may take a few minutes for the access status to change to Access granted.
Clustering Algorithms Techniques such as K-means clustering can help identify groups of similar data points. Points that do not belong to any cluster may be considered anomalies. Isolation Forest This algorithm isolates anomalies by randomly partitioning the data. How Can Data Anomalies Be Detected?
They are responsible for designing, building, and maintaining the infrastructure and tools needed to manage and process large volumes of data effectively. This involves working closely with dataanalysts and data scientists to ensure that data is stored, processed, and analyzed efficiently to derive insights that inform decision-making.
It helps in discovering hidden patterns and organizing text data into meaningful clusters. Topic Modeling and Document Clustering: Build a text mining project that performs topic modeling and document clustering. Cluster similar documents based on their content and explore relationships between topics.
Most solvers were data science professionals, professors, and students, but there were also many dataanalysts, project managers, and people working in public health and healthcare. The Results ¶ Over 750 participants joined the challenge. Participants represented a great variety of backgrounds.
A simple random data sampling example would be assigning a number to each person in the population and selecting random numbers. Cluster Sampling: Cluster sampling involves dividing the population into clusters or groups and randomly selecting entire clusters as the sample.
5 Industries Using Synthetic Data in Practice Here’s an overview of what synthetic data is and a few examples of how various industries have benefited from it. Here’s how. How to Use Machine Learning for Algorithmic Trading Machine learning has proven to be a huge boon to the finance industry. Learn more here.
By visualizing the network structure, analysts can identify key influencers, clusters, and pathways within the data. Geospatial Visualizations Geospatial visualizations combine geographical data with statistical information to create maps that reveal spatial patterns and trends.
Cluster Analysis It involves grouping similar data points based on certain characteristics. In customer segmentation for e-commerce, cluster analysis can help identify distinct customer groups with similar purchasing behaviour, enabling businesses to tailor marketing strategies for each segment.
Developed by Oracle Corporation, MySQL is an open-source database that provides a reliable and efficient way to store, retrieve, and manipulate data. Its versatility and ease of use have made it a favorite among developers, dataanalysts, and businesses of all sizes.
to understand the data’s main characteristics, distributions, and relationships. Modeling & Algorithms: Applying statistical models (like regression, classification, clustering) or Machine Learning algorithms to identify deeper patterns, make predictions, or classify data points. This helps formulate hypotheses.
Summary Table: Data Type in Tableau Data Type Definition Example Common Use Case String Textual characters “Customer Name” Categorizing data, adding labels Numerical Numbers (integers & decimals) 123.45 In Stock) Geographic Location data (postal codes, etc.) Well, Pickl.AI
Hypothesis testing and regression analysis are crucial for making predictions and understanding data relationships. Unsupervised Learning techniques such as clustering and dimensionality reduction to discover patterns in data. They also optimise algorithms to ensure robust performance in real-world applications.
By doing so, Data Scientists can better understand the structure of the data, identify trends, and generate new hypotheses for further study. Techniques: Data Visualisation: Graphs, charts, and plots to help visualise trends and outliers. Clustering: Grouping similar data points to identify segments within the data.
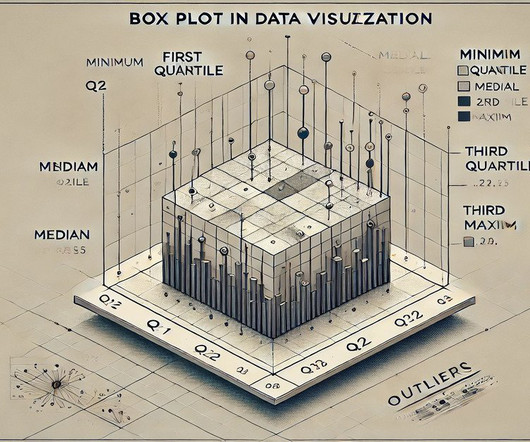
Purpose of Using a Box Plot in Data Visualisation Box Plots are widely used in Data Visualisation because they provide a clear and concise view of the data’s range, central value, and variability. Box Plots help detect patterns by showing how dataclusters around the median.
Format: Open source automatic graph drawing/design tool that uses a simple graph description language (DOT) for nodes, edges, clusters etc. is the sister project of Cytoscape, which is an open source software platform primarily aimed at dataanalysts and researchers working in life sciences and social sciences. Cytoscape.js
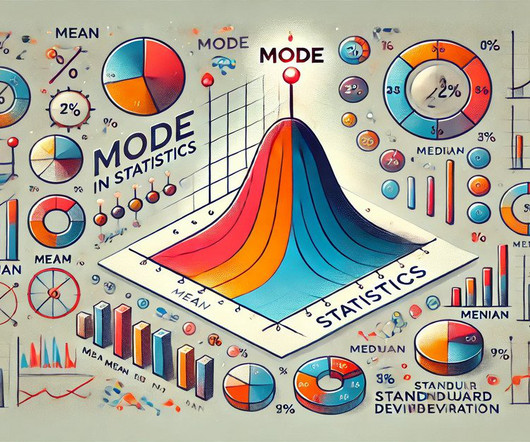
Bimodal distributions are useful when the data has two peaks or clusters, reflecting two dominant groups within a single dataset. Bimodal data may indicate a split or dual pattern in data, highlighting two distinct trends. Bimodal A Bimodal dataset has two modes, meaning two values appear with the highest frequency.
Tool Application within AI: Scikit-learn is primarily used for traditional machine learning tasks such as classification, regression, clustering, and dimensionality reduction. Moreover, thanks to its user-friendly interface, experimenting with different models is often as simple as changing a single line of code.
Scalability: It is suitable for enterprise-level data integration needs, offering scalability for handling large datasets efficiently. Read More: Advanced SQL Tips and Tricks for DataAnalysts. Hadoop Hadoop is an open-source framework designed for processing and storing big data across clusters of computer servers.
Predictive analytics and modeling: With Tableau’s integration with statistical tools, you can build predictive models using techniques like regression, classification, clustering, and time series analysis.
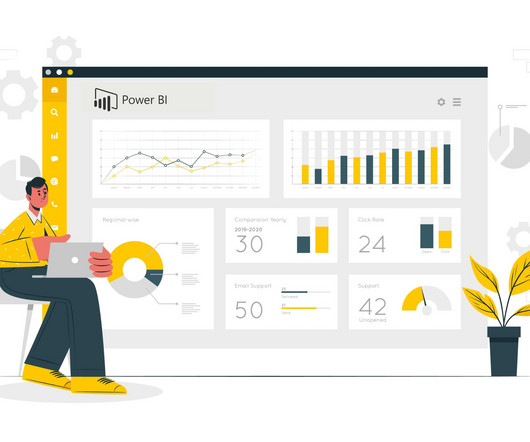
The following segment throws light on the key power BI features that make it one of the most widely adopted technologies: Attractive Visualizations One of the notable features of Power BI is that it offers a series of attractive visualisation which makes data comprehension easy. You will be able to create reports and dashboards.
We organize all of the trending information in your field so you don't have to. Join 17,000+ users and stay up to date on the latest articles your peers are reading.
You know about us, now we want to get to know you!
Let's personalize your content
Let's get even more personalized
We recognize your account from another site in our network, please click 'Send Email' below to continue with verifying your account and setting a password.


Let's personalize your content