This site uses cookies to improve your experience. To help us insure we adhere to various privacy regulations, please select your country/region of residence. If you do not select a country, we will assume you are from the United States. Select your Cookie Settings or view our Privacy Policy and Terms of Use.
Cookie Settings
Cookies and similar technologies are used on this website for proper function of the website, for tracking performance analytics and for marketing purposes. We and some of our third-party providers may use cookie data for various purposes. Please review the cookie settings below and choose your preference.
Used for the proper function of the website
Used for monitoring website traffic and interactions
Cookie Settings
Cookies and similar technologies are used on this website for proper function of the website, for tracking performance analytics and for marketing purposes. We and some of our third-party providers may use cookie data for various purposes. Please review the cookie settings below and choose your preference.
Strictly Necessary: Used for the proper function of the website
Performance/Analytics: Used for monitoring website traffic and interactions
This comprehensive blog outlines vital aspects of DataAnalyst interviews, offering insights into technical, behavioural, and industry-specific questions. It covers essential topics such as SQL queries, data visualization, statistical analysis, machine learning concepts, and data manipulation techniques.
Summary : This article equips DataAnalysts with a solid foundation of key Data Science terms, from A to Z. Introduction In the rapidly evolving field of Data Science, understanding key terminology is crucial for DataAnalysts to communicate effectively, collaborate effectively, and drive data-driven projects.
Summary: Python simplicity, extensive libraries like Pandas and Scikit-learn, and strong community support make it a powerhouse in DataAnalysis. It excels in data cleaning, visualisation, statistical analysis, and Machine Learning, making it a must-know tool for DataAnalysts and scientists.
Unfolding the difference between data engineer, data scientist, and dataanalyst. Data engineers are essential professionals responsible for designing, constructing, and maintaining an organization’s data infrastructure. These models may include regression, classification, clustering, and more.
ExploratoryDataAnalysis (EDA) ExploratoryDataAnalysis (EDA) is an approach to analyse datasets to uncover patterns, anomalies, or relationships. The primary purpose of EDA is to explore the data without any preconceived notions or hypotheses.
Dealing with large datasets: With the exponential growth of data in various industries, the ability to handle and extract insights from large datasets has become crucial. Data science equips you with the tools and techniques to manage big data, perform exploratorydataanalysis, and extract meaningful information from complex datasets.
It involves handling missing values, correcting errors, removing duplicates, standardizing formats, and structuring data for analysis. ExploratoryDataAnalysis (EDA): Using statistical summaries and initial visualisations (yes, visualisation plays a role within analysis!) This helps formulate hypotheses.
A Data Scientist requires to be able to visualize quickly the data before creating the model and Tableau is helpful for that. Predictive analytics and modeling: With Tableau’s integration with statistical tools, you can build predictive models using techniques like regression, classification, clustering, and time series analysis.
There is a position called DataAnalyst whose work is to analyze the historical data, and from that, they will derive some KPI s (Key Performance Indicators) for making any further calls. Feature Engineering plays a major part in the process of model building.
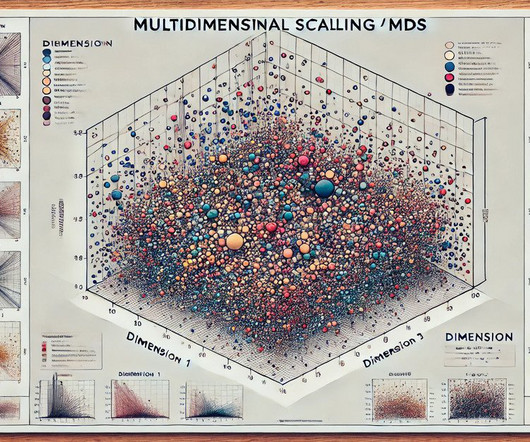
This step translates the high-dimensional data into a more manageable format. This representation reveals clusters, patterns, and relationships among the objects, enabling insights that might not be apparent in high-dimensional data. It enables researchers and DataAnalysts to visualise high-dimensional data effectively.
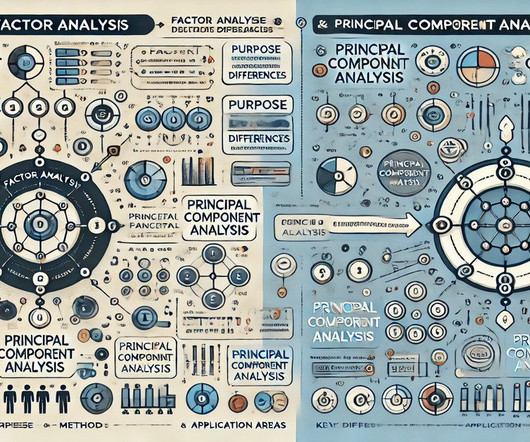
PCA is the go-to method when your primary goal is data compression without losing much information, especially when dealing with high-dimensional datasets. PCA is also commonly used in exploratoryDataAnalysis (EDA) when the aim is to detect patterns and relationships between variables before building more complex models.
Kaggle datasets) and use Python’s Pandas library to perform data cleaning, data wrangling, and exploratorydataanalysis (EDA). Extract valuable insights and patterns from the dataset using data visualization libraries like Matplotlib or Seaborn.
We organize all of the trending information in your field so you don't have to. Join 17,000+ users and stay up to date on the latest articles your peers are reading.
You know about us, now we want to get to know you!
Let's personalize your content
Let's get even more personalized
We recognize your account from another site in our network, please click 'Send Email' below to continue with verifying your account and setting a password.


Let's personalize your content