This site uses cookies to improve your experience. To help us insure we adhere to various privacy regulations, please select your country/region of residence. If you do not select a country, we will assume you are from the United States. Select your Cookie Settings or view our Privacy Policy and Terms of Use.
Cookie Settings
Cookies and similar technologies are used on this website for proper function of the website, for tracking performance analytics and for marketing purposes. We and some of our third-party providers may use cookie data for various purposes. Please review the cookie settings below and choose your preference.
Used for the proper function of the website
Used for monitoring website traffic and interactions
Cookie Settings
Cookies and similar technologies are used on this website for proper function of the website, for tracking performance analytics and for marketing purposes. We and some of our third-party providers may use cookie data for various purposes. Please review the cookie settings below and choose your preference.
Strictly Necessary: Used for the proper function of the website
Performance/Analytics: Used for monitoring website traffic and interactions
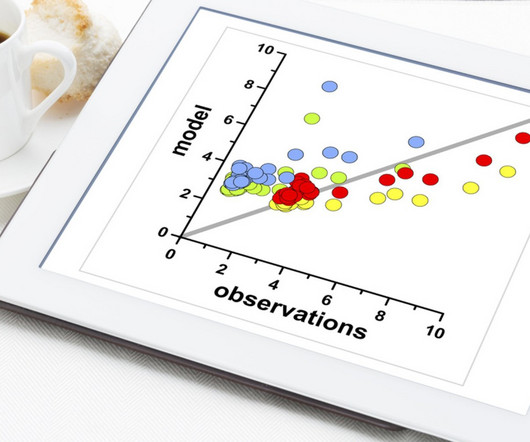
Plots in datascience play a pivotal role in unraveling complex insights from data. Learn about 33 tools to visualize data with this blog In this blog post, we will delve into some of the most important plots and concepts that are indispensable for any data scientist. Want to get started with datascience?
“Statistics is the grammar of science”, Karl Pearson In the world of datascience, there is a secret language that benefits those who understand it. Do you want to know what makes a data expert efficient? It’s having a profound understanding of the data. This is where inferential statistics comes in handy.
In the modern digital era, this particular area has evolved to give rise to a discipline known as DataScience. DataScience offers a comprehensive and systematic approach to extracting actionable insights from complex and unstructured data.
In contemporary times, datascience has emerged as a substantial and progressively expanding domain that has an impact on virtually every sphere of human ingenuity: be it commerce, technology, healthcare, education, governance, and beyond. This piece will concentrate on the elemental constituents constituting datascience.
Datascience bootcamps are intensive short-term educational programs designed to equip individuals with the skills needed to enter or advance in the field of datascience. They cover a wide range of topics, ranging from Python, R, and statistics to machine learning and data visualization.
Summary: Python for DataScience is crucial for efficiently analysing large datasets. Introduction Python for DataScience has emerged as a pivotal tool in the data-driven world. Key Takeaways Python’s simplicity makes it ideal for Data Analysis. in 2022, according to the PYPL Index.
This post is a bitesize walk-through of the 2021 Executive Guide to DataScience and AI — a white paper packed with up-to-date advice for any CIO or CDO looking to deliver real value through data. Team Building the right datascience team is complex. Download the free, unabridged version here.
DataScience is a popular as well as vast field; till date, there are a lot of opportunities in this field, and most people, whether they are working professionals or students, everyone want a transition in datascience because of its scope. How much to learn? What to do next?
What is R in DataScience? As a programming language it provides objects, operators and functions allowing you to explore, model and visualise data. Hence, you can use R for classification, clustering, statistical tests and linear and non-linear modelling. How is R Used in DataScience?
DataScience interviews are pivotal moments in the career trajectory of any aspiring data scientist. Having the knowledge about the datascience interview questions will help you crack the interview. DataScience skills that will help you excel professionally.
Summary: DataScience and AI are transforming the future by enabling smarter decision-making, automating processes, and uncovering valuable insights from vast datasets. Introduction DataScience and Artificial Intelligence (AI) are at the forefront of technological innovation, fundamentally transforming industries and everyday life.
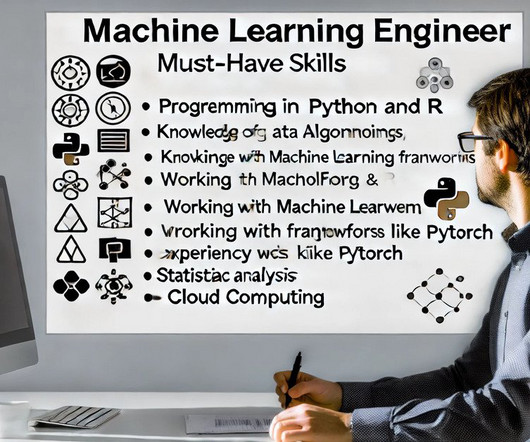
Machine learning engineer vs data scientist: two distinct roles with overlapping expertise, each essential in unlocking the power of data-driven insights. As businesses strive to stay competitive and make data-driven decisions, the roles of machine learning engineers and data scientists have gained prominence.
Statistics Possessing the right skills for data analysts is essential for success in this field. A strong foundation in statistics is crucial to apply statistical methods and models to analysis, including concepts like hypothesistesting, regression, and clustering analysis.
Summary: DataScience appears challenging due to its complexity, encompassing statistics, programming, and domain knowledge. However, aspiring data scientists can overcome obstacles through continuous learning, hands-on practice, and mentorship. However, many aspiring professionals wonder: Is DataScience hard?
Summary: The DataScience and Data Analysis life cycles are systematic processes crucial for uncovering insights from raw data. Quality data is foundational for accurate analysis, ensuring businesses stay competitive in the digital landscape. Understanding their life cycles is critical to unlocking their potential.
Whether you’re an aspiring professional or looking to transition into this dynamic field, understanding the essential skills required can pave the way for a successful career in DataScience. To embark on a successful journey in the realm of DataScience, mastering key skills is imperative.
Summary: The blog explores the synergy between Artificial Intelligence (AI) and DataScience, highlighting their complementary roles in Data Analysis and intelligent decision-making. Introduction Artificial Intelligence (AI) and DataScience are revolutionising how we analyse data, make decisions, and solve complex problems.
Summary : This article equips Data Analysts with a solid foundation of key DataScience terms, from A to Z. Introduction In the rapidly evolving field of DataScience, understanding key terminology is crucial for Data Analysts to communicate effectively, collaborate effectively, and drive data-driven projects.
With the expanding field of DataScience, the need for efficient and skilled professionals is increasing. Its efficacy may allow kids from a young age to learn Python and explore the field of DataScience. Its efficacy may allow kids from a young age to learn Python and explore the field of DataScience.
This means that as the sample size increases, the distribution of the sum or average becomes more tightly clustered around the mean of the distribution, and the shape of the distribution becomes more bell-shaped. One of the most important applications is hypothesistesting. [I
Together, data engineers, data scientists, and machine learning engineers form a cohesive team that drives innovation and success in data analytics and artificial intelligence. Their collective efforts are indispensable for organizations seeking to harness data’s full potential and achieve business growth.
Hey guys, in this blog we will see some of the most asked DataScience Interview Questions by interviewers in [year]. Datascience has become an integral part of many industries, and as a result, the demand for skilled data scientists is soaring. What is DataScience?
Model Selection: You need to choose an appropriate statistical model or technique that is based on the nature of the data and research question. This could be linear regression, logistic regression, clustering , time series analysis , etc. K-means clustering is used in market segmentation, image compression, and recommendation systems.
Summary: DataScience is becoming a popular career choice. Mastering programming, statistics, Machine Learning, and communication is vital for Data Scientists. A typical DataScience syllabus covers mathematics, programming, Machine Learning, data mining, big data technologies, and visualisation.
They will quantify these impacts by calculating lap times, identifying strategic patterns, and validating their findings with hypothesistesting. Click here to access the challenge and become part of our datascience community. About Ocean Protocol Ocean was founded to level the playing field for AI and data.
Key Objectives of Statistical Modeling Prediction : One of the primary goals of Statistical Modeling is to predict future outcomes based on historical data. HypothesisTesting : Statistical Models help test hypotheses by analysing relationships between variables.
Statsmodels Allows users to explore data, estimate statistical models, and perform statistical tests. It is particularly useful for regression analysis and hypothesistesting. Pingouin A library designed for statistical analysis, providing a comprehensive collection of statistical tests.
Concepts such as probability distributions, hypothesistesting , and Bayesian inference enable ML engineers to interpret results, quantify uncertainty, and improve model predictions. Unsupervised Learning Unsupervised learning involves training models on data without labels, where the system tries to find hidden patterns or structures.
By doing so, Data Scientists can better understand the structure of the data, identify trends, and generate new hypotheses for further study. Techniques: Data Visualisation: Graphs, charts, and plots to help visualise trends and outliers. Clustering: Grouping similar data points to identify segments within the data.
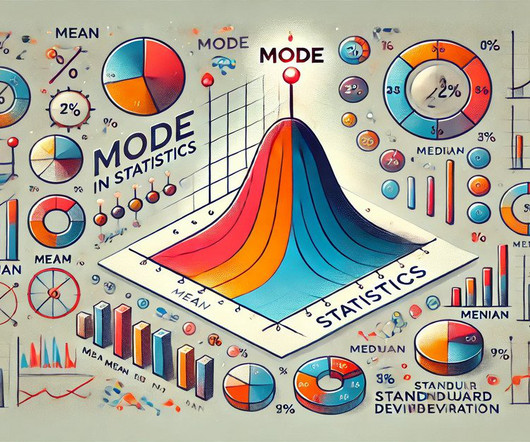
Here are some important blogs for you related to statistics: Process and Types of HypothesisTesting in Statistics. Crucial Statistics Interview Questions for DataScience Success. Bimodal distributions are useful when the data has two peaks or clusters, reflecting two dominant groups within a single dataset.
Big Data Technologies and Tools A comprehensive syllabus should introduce students to the key technologies and tools used in Big Data analytics. Some of the most notable technologies include: Hadoop An open-source framework that allows for distributed storage and processing of large datasets across clusters of computers.
The career of a Data Analyst is highly lucrative today and with the right skills, your dream job is just around the corner. It is expected that the DataScience market will have more than 11 million job roles in India by 2030, opening up opportunities for you.
I would perform exploratory data analysis to understand the distribution of customer transactions and identify potential segments. Then, I would use clustering techniques such as k-means or hierarchical clustering to group customers based on similarities in their purchasing behaviour. What approach would you take?
If you’re an aspiring DataScience professional , Data Visualisation will be part of your job role in presenting the insights in a visually understandable format. However, if you’re a beginner in the field, you need to undertake a Data Visualisation course for a beginner.
In statistics: – Utilized for hypothesistesting to assess the validity of statistical models. – An effective tool in clustering and classification tasks, enhancing the performance of group analysis. – Addresses challenges presented by imbalanced datasets, which is crucial for refining classification tasks.
We organize all of the trending information in your field so you don't have to. Join 17,000+ users and stay up to date on the latest articles your peers are reading.
You know about us, now we want to get to know you!
Let's personalize your content
Let's get even more personalized
We recognize your account from another site in our network, please click 'Send Email' below to continue with verifying your account and setting a password.


Let's personalize your content