This site uses cookies to improve your experience. To help us insure we adhere to various privacy regulations, please select your country/region of residence. If you do not select a country, we will assume you are from the United States. Select your Cookie Settings or view our Privacy Policy and Terms of Use.
Cookie Settings
Cookies and similar technologies are used on this website for proper function of the website, for tracking performance analytics and for marketing purposes. We and some of our third-party providers may use cookie data for various purposes. Please review the cookie settings below and choose your preference.
Used for the proper function of the website
Used for monitoring website traffic and interactions
Cookie Settings
Cookies and similar technologies are used on this website for proper function of the website, for tracking performance analytics and for marketing purposes. We and some of our third-party providers may use cookie data for various purposes. Please review the cookie settings below and choose your preference.
Strictly Necessary: Used for the proper function of the website
Performance/Analytics: Used for monitoring website traffic and interactions
Machine learning engineer vs datascientist: two distinct roles with overlapping expertise, each essential in unlocking the power of data-driven insights. As businesses strive to stay competitive and make data-driven decisions, the roles of machine learning engineers and datascientists have gained prominence.
t-SNE (t-distributed stochastic neighbor embedding) has become an essential tool in the realm of data analytics, standing out for its ability to unravel the complexities inherent in high-dimensional data. This enables researchers to identify clusters and similarities among the data points more intuitively.
Some of the applications of data science are driverless cars, gaming AI, movie recommendations, and shopping recommendations. Since the field covers such a vast array of services, datascientists can find a ton of great opportunities in their field. Datascientists use algorithms for creating data models.
DataScientists are highly in demand across different industries for making use of the large volumes of data for analysisng and interpretation and enabling effective decision making. One of the most effective programming languages used by DataScientists is R, that helps them to conduct dataanalysis and make future predictions.
Clustering — Beyonds KMeans+PCA… Perhaps the most popular way of clustering is K-Means. It natively supports only numerical data, so typically an encoding is applied first for converting the categorical data into a numerical form. this link ).
Its robust ecosystem of libraries and frameworks tailored for Data Science, such as NumPy, Pandas, and Scikit-learn, contributes significantly to its popularity. Moreover, Python’s straightforward syntax allows DataScientists to focus on problem-solving rather than grappling with complex code.
For instance, if datascientists were building a model for tornado forecasting, the input variables might include date, location, temperature, wind flow patterns and more, and the output would be the actual tornado activity recorded for those days. the target or outcome variable is known).
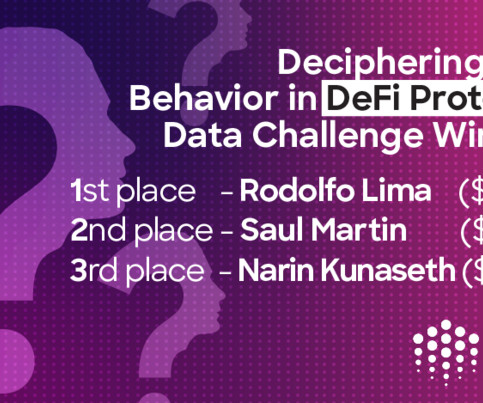
This challenge asked participants to gather their own data on their favorite DeFi protocol. From there, participants were asked to conduct exploratorydataanalysis, explore recommendations to the protocol, and dive into key metrics and user retention rates that correlate and precede the success of a given protocol.
Answering one of the most common questions I get asked as a Senior DataScientist — What skills and educational background are necessary to become a datascientist? Photo by Eunice Lituañas on Unsplash To become a datascientist, a combination of technical skills and educational background is typically required.
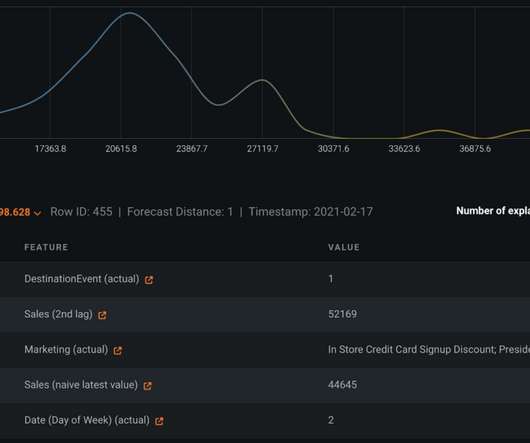
Datascientists have used the DataRobot AI Cloud platform to build time series models for several years. Recently, new forecasting features and an improved integration with Google BigQuery have empowered datascientists to build models with greater speed, accuracy, and confidence. Forecasting the future is difficult.
It combines elements of statistics, mathematics, computer science, and domain expertise to extract meaningful patterns from large volumes of data. Role of DataScientists in Modern Industries DataScientists drive innovation and competitiveness across industries in today’s fast-paced digital world.
Data preprocessing ensures the removal of incorrect, incomplete, and inaccurate data from datasets, leading to the creation of accurate and useful datasets for analysis ( Image Credit ) Data completeness One of the primary requirements for data preprocessing is ensuring that the dataset is complete, with minimal missing values.
Discover the reasons behind Python’s dominance in dataanalysis, from its user-friendly syntax and extensive libraries to its scalability and community support, making it the go-to language for datascientists and analysts worldwide. It provides tools for classification, regression, clustering, and more.
Unfolding the difference between data engineer, datascientist, and data analyst. Data engineers are essential professionals responsible for designing, constructing, and maintaining an organization’s data infrastructure. Role of DataScientistsDataScientists are the architects of dataanalysis.
With the help of Tableau, organisations have been able to mine and gather actionable insights from granular sources of data. Tableau can help DataScientists generate graphs, charts, maps and data-driven stories, etc for purpose of visualisation and analysing data.
Bridging the Interpretability Gap in Customer Segmentation Evie Fowler | Senior DataScientist | Fulcrum Analytics Historically, there have been two main approaches to segmentation: rules-based and machine learning-driven. It continues with the selection of a clustering algorithm and the fine-tuning of a model to create clusters.
The programming language can handle Big Data and perform effective dataanalysis and statistical modelling. R allows you to conduct statistical analysis and offers capabilities of statistical and graphical representation. How is R Used in Data Science? It is a DataScientist’s best friend.
Dealing with large datasets: With the exponential growth of data in various industries, the ability to handle and extract insights from large datasets has become crucial. Data science equips you with the tools and techniques to manage big data, perform exploratorydataanalysis, and extract meaningful information from complex datasets.
F1 :: 2024 Strategy Analysis Poster ‘The Formula 1 Racing Challenge’ challenges participants to analyze race strategies during the 2024 season. They will work with lap-by-lap data to assess how pit stop timing, tire selection, and stint management influence race performance. How to Participate Are you ready to join us on this quest?
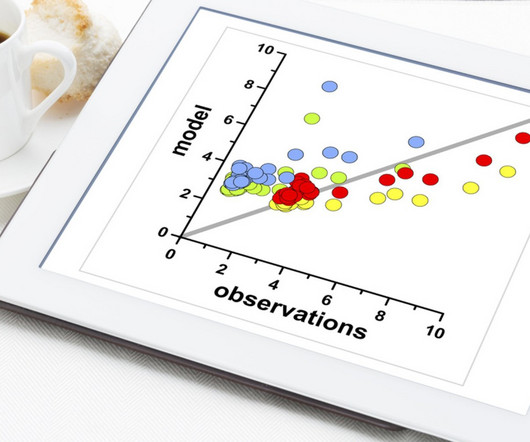
ExploratoryDataAnalysis (EDA) ExploratoryDataAnalysis (EDA) is an approach to analyse datasets to uncover patterns, anomalies, or relationships. The primary purpose of EDA is to explore the data without any preconceived notions or hypotheses.
Data Normalization and Standardization: Scaling numerical data to a standard range to ensure fairness in model training. ExploratoryDataAnalysis (EDA) EDA is a crucial preliminary step in understanding the characteristics of the dataset.
Plotly allows developers to embed interactive features such as zooming, panning, and hover effects directly into the plots, making it ideal for ExploratoryDataAnalysis and dynamic reports. Bar Charts Bar charts help compare categorical data across different groups.
Data Science interviews are pivotal moments in the career trajectory of any aspiring datascientist. Having the knowledge about the data science interview questions will help you crack the interview. Clustering algorithms such as K-means and hierarchical clustering are examples of unsupervised learning techniques.
Note : Now, Start joining Data Science communities on social media platforms. These communities will help you to be updated in the field, because there are some experienced datascientists posting the stuff, or you can talk with them so they will also guide you in your journey.
I would perform exploratorydataanalysis to understand the distribution of customer transactions and identify potential segments. Then, I would use clustering techniques such as k-means or hierarchical clustering to group customers based on similarities in their purchasing behaviour. What approach would you take?
As a datascientist at Cars4U, I had to come up with a pricing model that can effectively predict the price of used cars and can help the business in devising profitable strategies using differential pricing. In this analysis, I: provided summary statistics and exploratorydataanalysis of the data.
Data Science is the art and science of extracting valuable information from data. It encompasses data collection, cleaning, analysis, and interpretation to uncover patterns, trends, and insights that can drive decision-making and innovation.
To address this challenge, datascientists harness the power of machine learning to predict customer churn and develop strategies for customer retention. Continuous Experiment Tracking with Comet ML Comet ML is a versatile tool that helps datascientists optimize machine learning experiments.
You can understand the data and model’s behavior at any time. Once you use a training dataset, and after the ExploratoryDataAnalysis, DataRobot flags any data quality issues and, if significant issues are spotlighted, will automatically handle them in the modeling stage. Rapid Modeling with DataRobot AutoML.
Visualization is crucial to any machine learning project to understand complex data. It is a powerful tool that illuminates patterns, trends, and anomalies, enabling datascientists and stakeholders to make informed decisions. It provides tools and services that help datascientists manage, track, and deploy their models.
Solvers submitted a wide range of methodologies to this end, including using open-source and third party LLMs (GPT, LLaMA), clustering (DBSCAN, K-Means), dimensionality reduction (PCA), topic modeling (LDA, BERT), sentence transformers, semantic search, named entity recognition, and more. and DistilBERT. What motivated you to participate? :
We organize all of the trending information in your field so you don't have to. Join 17,000+ users and stay up to date on the latest articles your peers are reading.
You know about us, now we want to get to know you!
Let's personalize your content
Let's get even more personalized
We recognize your account from another site in our network, please click 'Send Email' below to continue with verifying your account and setting a password.


Let's personalize your content