This site uses cookies to improve your experience. To help us insure we adhere to various privacy regulations, please select your country/region of residence. If you do not select a country, we will assume you are from the United States. Select your Cookie Settings or view our Privacy Policy and Terms of Use.
Cookie Settings
Cookies and similar technologies are used on this website for proper function of the website, for tracking performance analytics and for marketing purposes. We and some of our third-party providers may use cookie data for various purposes. Please review the cookie settings below and choose your preference.
Used for the proper function of the website
Used for monitoring website traffic and interactions
Cookie Settings
Cookies and similar technologies are used on this website for proper function of the website, for tracking performance analytics and for marketing purposes. We and some of our third-party providers may use cookie data for various purposes. Please review the cookie settings below and choose your preference.
Strictly Necessary: Used for the proper function of the website
Performance/Analytics: Used for monitoring website traffic and interactions
Photo by Aditya Chache on Unsplash DBSCAN in Density Based Algorithms : Density Based Spatial Clustering Of Applications with Noise. Earlier Topics: Since, We have seen centroid based algorithm for clustering like K-Means.Centroid based : K-Means, K-Means ++ , K-Medoids. & One among the many density based algorithms is “DBSCAN”.
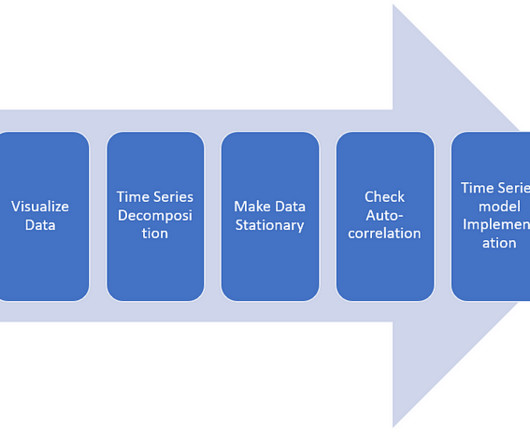
Please refer to Part 1– to understand what is Sales Prediction/Forecasting, the Basic concepts of Time series modeling, and EDA I’m working on Part 3 where I will be implementing Deep Learning and Part 4 where I will be implementing a supervised ML model.
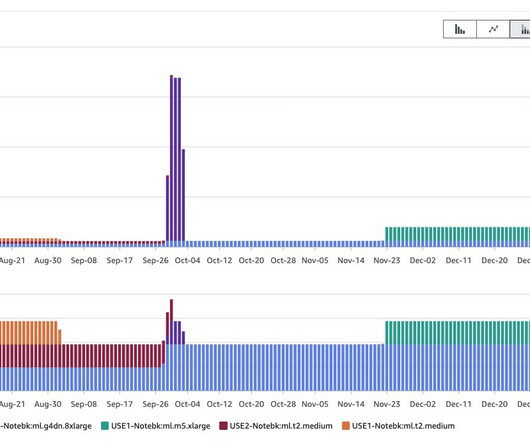
Since its introduction, we have helped hundreds of customers optimize their workloads, set guardrails, and improve the visibility of their machine learning (ML) workloads’ cost and usage. Notebooks contain everything needed to run or recreate an ML workflow. SageMaker manages creating the instance and related resources.
Scikit-learn covers various classification , regression , clustering , and dimensionality reduction algorithms. Perform exploratory Data Analysis (EDA) using Pandas and visualise your findings with Matplotlib or Seaborn. Scikit-learn Scikit-learn is the go-to library for Machine Learning in Python.
The primary goal of the Kaggle competition is creating an ML Model that can predict the total number of bikes rented. The first part requires you to focus on understanding, analysing and processing datasets; the second part is about designing the model using ML Library.
In this article, we take a deep dive into a machine learning project aimed at predicting customer churn and explore how Comet ML, a powerful machine learning experiment tracking platform, plays a key role in increasing project success. ?I Our project uses Comet ML to: 1. The entire code can be found on both GitHub and Kaggle.
Here are a few of the key concepts that you should know: Machine Learning (ML) This is a type of AI that allows computers to learn without being explicitly programmed. Exploratory Data Analysis (EDA) EDA is a crucial preliminary step in understanding the characteristics of the dataset.
This includes skills in data cleaning, preprocessing, transformation, and exploratory data analysis (EDA). In spite of all this, over the next few years I do expect the requirement for entry-level DS/ML roles to go down, as it did with SDE-role. Familiarity with libraries like pandas, NumPy, and SQL for data handling is important.
For Data Analysis you can focus on such topics as Feature Engineering , Data Wrangling , and EDA which is also known as Exploratory Data Analysis. First learn the basics of Feature Engineering, and EDA then take some different-different data sheets (data frames) and apply all the techniques you have learned to date.
Exploratory Data Analysis (EDA) Univariate EDA Price: The price of a used car is the target variable and has a highly skewed distribution, with a median value of around 53.5 Bivariate EDA Contrary to intuition, Kilometers_Driven does not seem to have a relationship with the price. Both histograms are slightly right skewed.
Build and deploy your own sentiment classification app using Python and Streamlit Source:Author Nowadays, working on tabular data is not the only thing in Machine Learning (ML). This approach is mostly referred to for small datasets where ML models can not be effective. Data formats like image, video, text, etc.,
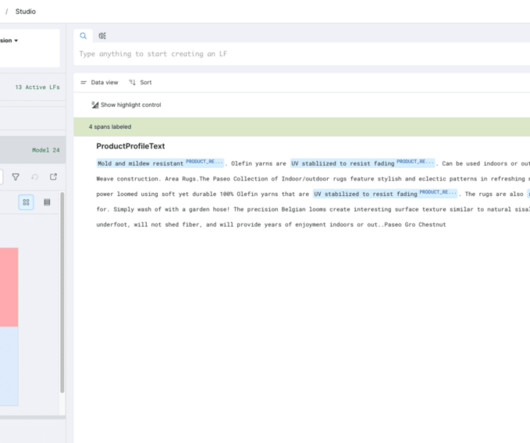
ML practitioners are increasingly coming to appreciate that while foundation models like LLMs provide a fantastic foundation for AI applications, best results are achieved with additional data-centric development. Built-in tools for EDA (filtering, sorting, clustering, tagging, etc.)
ML practitioners are increasingly coming to appreciate that while foundation models like LLMs provide a fantastic foundation for AI applications, best results are achieved with additional data-centric development. Built-in tools for EDA (filtering, sorting, clustering, tagging, etc.)
ML practitioners are increasingly coming to appreciate that while foundation models like LLMs provide a fantastic foundation for AI applications, best results are achieved with additional data-centric development. Built-in tools for EDA (filtering, sorting, clustering, tagging, etc.)
We have to click on Clustered column chart visualization … because we want an easily graphs to show easy comparison between multiple categories and their respective values. Figure 19: Question 3 Visualization We can see the most searches by Brand is MG (greater than 20K) for the users. Q4: How many searches by brand and country are there?
Solvers submitted a wide range of methodologies to this end, including using open-source and third party LLMs (GPT, LLaMA), clustering (DBSCAN, K-Means), dimensionality reduction (PCA), topic modeling (LDA, BERT), sentence transformers, semantic search, named entity recognition, and more. and DistilBERT.
It is a crucial component of the Exploration Data Analysis (EDA) stage, which is typically the first and most critical step in any data project. point clouds projection on XY, XZ and YZ plane (source from FITTING A CIRCLE TO CLUSTER OF 3D POINTS ) 2. Why do we choose Python data visualization tools for our projects?
The onset of the pandemic has triggered a rapid increase in the demand and adoption of ML technology. Building ML team Following the surge in ML use cases that have the potential to transform business, the leaders are making a significant investment in ML collaboration, building teams that can deliver the promise of machine learning.
We organize all of the trending information in your field so you don't have to. Join 17,000+ users and stay up to date on the latest articles your peers are reading.
You know about us, now we want to get to know you!
Let's personalize your content
Let's get even more personalized
We recognize your account from another site in our network, please click 'Send Email' below to continue with verifying your account and setting a password.


Let's personalize your content