This site uses cookies to improve your experience. To help us insure we adhere to various privacy regulations, please select your country/region of residence. If you do not select a country, we will assume you are from the United States. Select your Cookie Settings or view our Privacy Policy and Terms of Use.
Cookie Settings
Cookies and similar technologies are used on this website for proper function of the website, for tracking performance analytics and for marketing purposes. We and some of our third-party providers may use cookie data for various purposes. Please review the cookie settings below and choose your preference.
Used for the proper function of the website
Used for monitoring website traffic and interactions
Cookie Settings
Cookies and similar technologies are used on this website for proper function of the website, for tracking performance analytics and for marketing purposes. We and some of our third-party providers may use cookie data for various purposes. Please review the cookie settings below and choose your preference.
Strictly Necessary: Used for the proper function of the website
Performance/Analytics: Used for monitoring website traffic and interactions
Top statistical techniques – Data Science Dojo Counterfactual causal inference: Counterfactual causal inference is a statistical technique that is used to evaluate the causal significance of historical events. This technique can be used in a wide range of fields such as economics, history, and social sciences.
SupportVectorMachines (SVM): This algorithm finds a hyperplane that best separates data points of different classes in high-dimensional space. Anomaly Detection Anomaly detection, like noticing a misspelled word in an essay, equips machine learning models to identify data points that deviate significantly from the norm.
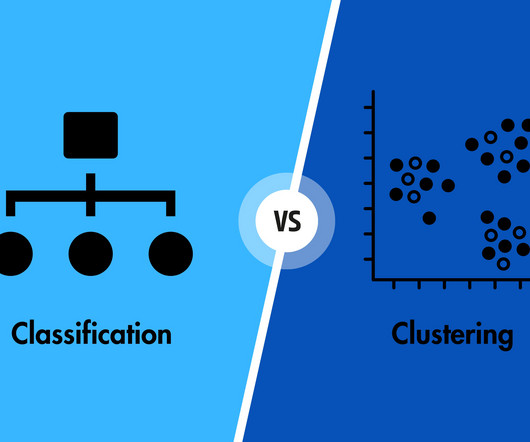
ML algorithms fall into various categories which can be generally characterised as Regression, Clustering, and Classification. While Classification is an example of directed Machine Learning technique, Clustering is an unsupervised Machine Learning algorithm. What is Classification? Hence, the assumption causes a problem.
Home Table of Contents Credit Card Fraud Detection Using Spectral Clustering Understanding Anomaly Detection: Concepts, Types and Algorithms What Is Anomaly Detection? Spectral clustering, a technique rooted in graph theory, offers a unique way to detect anomalies by transforming data into a graph and analyzing its spectral properties.
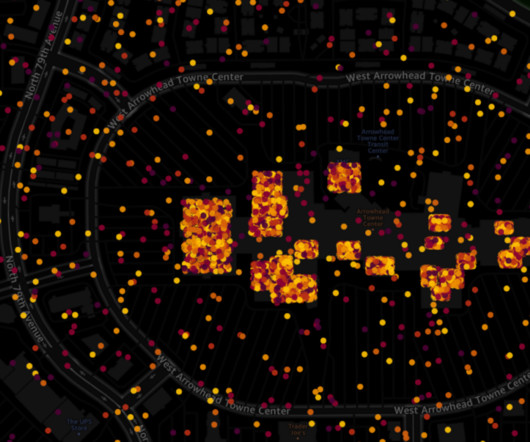
It can represent a geographical area as a whole or it can represent an event associated with a geographical area. We can analyze activities by identifying stops made by the user or mobile device by clustering pings using ML models in Amazon SageMaker. Manually managing a DIY compute cluster is slow and expensive.
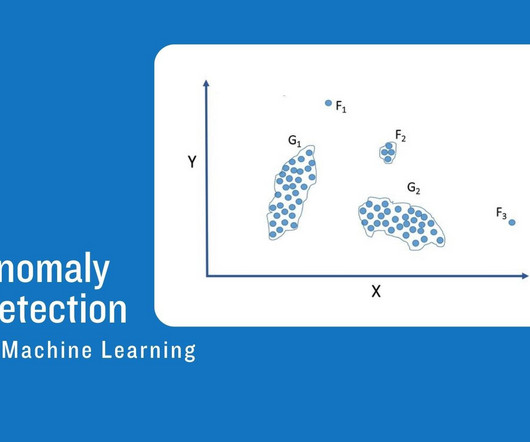
As organizations collect larger data sets with potential insights into business activity, detecting anomalous data, or outliers in these data sets, is essential in discovering inefficiencies, rare events, the root cause of issues, or opportunities for operational improvements. But what is an anomaly and why is detecting it important?
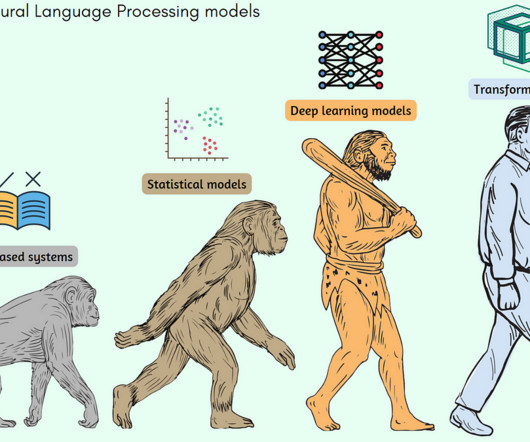
Three significant events affected the evolution of these models. The earlier models that were SOTA for NLP mainly fell under the traditional machine learning algorithms. These included the Supportvectormachine (SVM) based models. 2018) “ Language models are few-shot learners ” by Brown et al.
This enables them to respond quickly to changing conditions or events. Supervised learning algorithms, like decision trees, supportvectormachines, or neural networks, enable IoT devices to learn from historical data and make accurate predictions.
Observations that deviate from the majority of the data are known as anomalies and might take the shape of occurrences, trends, or events that differ from customary or expected behaviour. Finding anomalous occurrences that might point to intriguing or potentially significant events is the aim of anomaly detection.
Are there clusters of customers with different spending patterns? #3. Model Training We train multiple machine learning models, including Logistic Regression, Random Forest, Gradient Boosting, and SupportVectorMachine. SupportVectorMachine (svm): Versatile model for linear and non-linear data.
They identify patterns in existing data and use them to predict unknown events. Applications : Stock price prediction and financial forecasting Analysing sales trends over time Demand forecasting in supply chain management Clustering Models Clustering is an unsupervised learning technique used to group similar data points together.
Some of the most notable technologies include: Hadoop An open-source framework that allows for distributed storage and processing of large datasets across clusters of computers. Students should understand the concepts of event-driven architecture and stream processing. Knowledge of RESTful APIs and authentication methods is essential.
Machine Learning Tools in Bioinformatics Machine learning is vital in bioinformatics, providing data scientists and machine learning engineers with powerful tools to extract knowledge from biological data. Clustering algorithms can group similar biological samples or identify distinct subtypes within a disease.
C Classification: A supervised Machine Learning task that assigns data points to predefined categories or classes based on their characteristics. Clustering: An unsupervised Machine Learning technique that groups similar data points based on their inherent similarities.
Classification techniques like random forests, decision trees, and supportvectormachines are among the most widely used, enabling tasks such as categorizing data and building predictive models. Clustering methods are similarly important, particularly for grouping data into meaningful segments without predefined labels.
This allows it to evaluate and find relationships between the data points which is essential for clustering. Supports batch processing for quick processing for the images. Query Synthesis Scenario : Training a model to classify rare astronomical events using synthetic telescope data.
There are majorly two categories of sampling techniques based on the usage of statistics, they are: Probability Sampling techniques: Clustered sampling, Simple random sampling, and Stratified sampling. Another example can be the algorithm of a supportvectormachine. These are called supportvectors.
SupportVectorMachines: A method that finds the hyperplane separating different classes with the largest margin. Examples of unsupervised tasks include clustering and dimensionality reduction, which do not have a clear output requirement.
We organize all of the trending information in your field so you don't have to. Join 17,000+ users and stay up to date on the latest articles your peers are reading.
You know about us, now we want to get to know you!
Let's personalize your content
Let's get even more personalized
We recognize your account from another site in our network, please click 'Send Email' below to continue with verifying your account and setting a password.


Let's personalize your content