This site uses cookies to improve your experience. To help us insure we adhere to various privacy regulations, please select your country/region of residence. If you do not select a country, we will assume you are from the United States. Select your Cookie Settings or view our Privacy Policy and Terms of Use.
Cookie Settings
Cookies and similar technologies are used on this website for proper function of the website, for tracking performance analytics and for marketing purposes. We and some of our third-party providers may use cookie data for various purposes. Please review the cookie settings below and choose your preference.
Used for the proper function of the website
Used for monitoring website traffic and interactions
Cookie Settings
Cookies and similar technologies are used on this website for proper function of the website, for tracking performance analytics and for marketing purposes. We and some of our third-party providers may use cookie data for various purposes. Please review the cookie settings below and choose your preference.
Strictly Necessary: Used for the proper function of the website
Performance/Analytics: Used for monitoring website traffic and interactions
Summary: Python for Data Science is crucial for efficiently analysing large datasets. With numerous resources available, mastering Python opens up exciting career opportunities. Introduction Python for Data Science has emerged as a pivotal tool in the data-driven world. in 2022, according to the PYPL Index.
Programming Language (R or Python). Programming knowledge is needed for the typical tasks of transforming data, creating graphs, and creating data models. Programmers can start with either R or Python. it is overwhelming to learn data science concepts and a general-purpose language like python at the same time.
How this machine learning model has become a sustainable and reliable solution for edge devices in an industrial network An Introduction Clustering (clusteranalysis - CA) and classification are two important tasks that occur in our daily lives. Thus, this type of task is very important for exploratorydataanalysis.
Clustering — Beyonds KMeans+PCA… Perhaps the most popular way of clustering is K-Means. It natively supports only numerical data, so typically an encoding is applied first for converting the categorical data into a numerical form. this link ).
Python machine learning packages have emerged as the go-to choice for implementing and working with machine learning algorithms. These libraries, with their rich functionalities and comprehensive toolsets, have become the backbone of data science and machine learning practices. Why do you need Python machine learning packages?
They employ statistical and mathematical techniques to uncover patterns, trends, and relationships within the data. Data scientists possess a deep understanding of statistical modeling, data visualization, and exploratorydataanalysis to derive actionable insights and drive business decisions.
Summary: Python simplicity, extensive libraries like Pandas and Scikit-learn, and strong community support make it a powerhouse in DataAnalysis. It excels in data cleaning, visualisation, statistical analysis, and Machine Learning, making it a must-know tool for Data Analysts and scientists. Why Python?
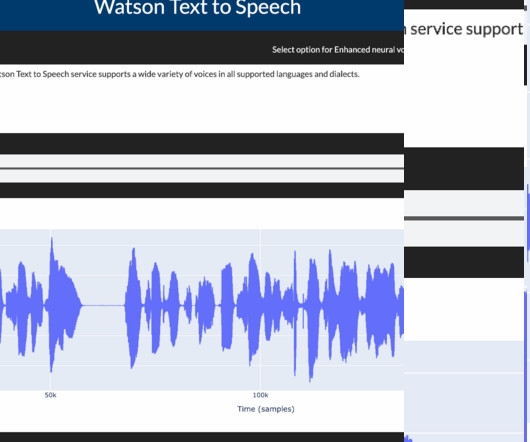
Data Processing and EDA (ExploratoryDataAnalysis) Speech synthesis services require that the data be in a JSON format. To access this service, you can use the Python requests library. Text-to-speech service After the post request, you can save the audio output in your local directory or the cluster.
Summary: This guide explores Artificial Intelligence Using Python, from essential libraries like NumPy and Pandas to advanced techniques in machine learning and deep learning. Python’s simplicity, versatility, and extensive library support make it the go-to language for AI development.
Summary: Plotly in Python is a powerful library enabling users to create interactive visualisations easily. Among the many tools available, Plotly in Python stands out for its ability to create dynamic, interactive visualisations. Once the installation is complete, you can create interactive visualisations in Python.
It’s an open-source Python package for ExploratoryDataAnalysis of text. It has functions for the analysis of explicit text elements such as words, n-grams, POS tags, and multi-word expressions, as well as implicit elements such as clusters, anomalies, and biases.
As a data scientist at Cars4U, I had to come up with a pricing model that can effectively predict the price of used cars and can help the business in devising profitable strategies using differential pricing. In this analysis, I: provided summary statistics and exploratorydataanalysis of the data.
Overview of Typical Tasks and Responsibilities in Data Science As a Data Scientist, your daily tasks and responsibilities will encompass many activities. You will collect and clean data from multiple sources, ensuring it is suitable for analysis. Must Check Out: How to Use ChatGPT APIs in Python: A Comprehensive Guide.
Mathematics for Machine Learning and Data Science Specialization Proficiency in Programming Data scientists need to be skilled in programming languages commonly used in data science, such as Python or R. These languages are used for data manipulation, analysis, and building machine learning models.
One is a scripting language such as Python, and the other is a Query language like SQL (Structured Query Language) for SQL Databases. Python is a High-level, Procedural, and object-oriented language; it is also a vast language itself, and covering the whole of Python is one the worst mistakes we can make in the data science journey.
Data engineers are essential professionals responsible for designing, constructing, and maintaining an organization’s data infrastructure. They create data pipelines, ETL processes, and databases to facilitate smooth data flow and storage. These models may include regression, classification, clustering, and more.
I would perform exploratorydataanalysis to understand the distribution of customer transactions and identify potential segments. Then, I would use clustering techniques such as k-means or hierarchical clustering to group customers based on similarities in their purchasing behaviour. What approach would you take?
ExploratoryDataAnalysis (EDA) ExploratoryDataAnalysis (EDA) is an approach to analyse datasets to uncover patterns, anomalies, or relationships. The primary purpose of EDA is to explore the data without any preconceived notions or hypotheses.
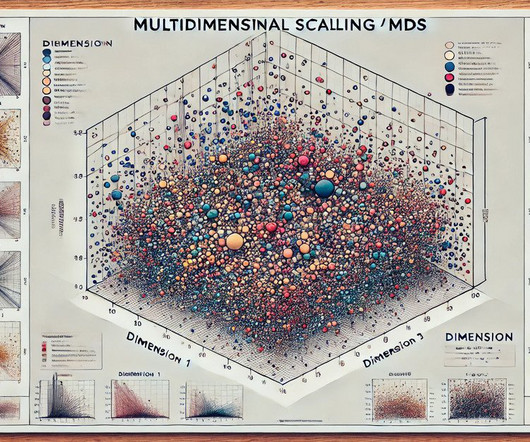
This step translates the high-dimensional data into a more manageable format. This representation reveals clusters, patterns, and relationships among the objects, enabling insights that might not be apparent in high-dimensional data. It enables researchers and Data Analysts to visualise high-dimensional data effectively.
Dealing with large datasets: With the exponential growth of data in various industries, the ability to handle and extract insights from large datasets has become crucial. Data science equips you with the tools and techniques to manage big data, perform exploratorydataanalysis, and extract meaningful information from complex datasets.
A Data Scientist requires to be able to visualize quickly the data before creating the model and Tableau is helpful for that. Tableau also supports advanced statistical modeling through integration with statistical tools like R and Python.
It involves handling missing values, correcting errors, removing duplicates, standardizing formats, and structuring data for analysis. ExploratoryDataAnalysis (EDA): Using statistical summaries and initial visualisations (yes, visualisation plays a role within analysis!) This helps formulate hypotheses.
These may range from Data Analytics projects for beginners to experienced ones. Following is a guide that can help you understand the types of projects and the projects involved with Python and Business Analytics. Here are some project ideas suitable for students interested in big data analytics with Python: 1.
Technical Proficiency Data Science interviews typically evaluate candidates on a myriad of technical skills spanning programming languages, statistical analysis, Machine Learning algorithms, and data manipulation techniques. Handling missing values is a critical aspect of data preprocessing.
The project I did to land my business intelligence internship — CAR BRAND SEARCH ETL PROCESS WITH PYTHON, POSTGRESQL & POWER BI 1. Section 3: The technical section for the project where Python and pgAdmin4 will be used. Section 4: Reporting data for the project insights. Figure 6: Project’s Dashboard 3. Windows NT 10.0;
C Classification: A supervised Machine Learning task that assigns data points to predefined categories or classes based on their characteristics. Clustering: An unsupervised Machine Learning technique that groups similar data points based on their inherent similarities.
Import Libraries First, import the required Python libraries, such as Comet ML, Optuna, and scikit-learn. These libraries provide tools for data preprocessing, model training, and hyperparameter tuning. !pip In a typical MLOps project, similar scheduling is essential to handle new data and track model performance continuously.
It is a crucial component of the Exploration DataAnalysis (EDA) stage, which is typically the first and most critical step in any data project. Why do we choose Pythondata visualization tools for our projects? Moreover, Python can seamlessly integrate with other popular data visualization languages like R.
In this article, you will learn various tools and techniques to visualize different models along with their Python implementation. It is time to learn about some crucial model visualization tools with Python implementation. Besides, Model Visualization also reveals which features contribute most to the model's predictions.
In this challenge, solvers submitted an analysis notebook (in R or Python) and a 1-3 page executive summary that highlighted their key findings, summarized their approach, and included selected visualizations from their analyses. Solution format. Guiding questions. and DistilBERT.
We organize all of the trending information in your field so you don't have to. Join 17,000+ users and stay up to date on the latest articles your peers are reading.
You know about us, now we want to get to know you!
Let's personalize your content
Let's get even more personalized
We recognize your account from another site in our network, please click 'Send Email' below to continue with verifying your account and setting a password.


Let's personalize your content