This site uses cookies to improve your experience. To help us insure we adhere to various privacy regulations, please select your country/region of residence. If you do not select a country, we will assume you are from the United States. Select your Cookie Settings or view our Privacy Policy and Terms of Use.
Cookie Settings
Cookies and similar technologies are used on this website for proper function of the website, for tracking performance analytics and for marketing purposes. We and some of our third-party providers may use cookie data for various purposes. Please review the cookie settings below and choose your preference.
Used for the proper function of the website
Used for monitoring website traffic and interactions
Cookie Settings
Cookies and similar technologies are used on this website for proper function of the website, for tracking performance analytics and for marketing purposes. We and some of our third-party providers may use cookie data for various purposes. Please review the cookie settings below and choose your preference.
Strictly Necessary: Used for the proper function of the website
Performance/Analytics: Used for monitoring website traffic and interactions
Technical Fellow, Tableau. Tableau has been helping people and organizations to see and understand data for almost two decades, bringing exciting innovations to the landscape of business intelligence with every product release. I am proud to announce that my History of Tableau Innovation viz is now published to Tableau Public.
It’s one of our guiding principles at Tableau and why we support students and instructors around the globe through Tableau Academic Programs. When I first joined the Tableau Academic Programs Team in 2017, many professors would refer me to their ComputerScience or Statistics department.
Brand Marketing Intern at Tableau, A Salesforce Company. Data skills were not top of mind when I began my Brand Marketing internship this summer, however, I’ve relied on the basics of my analytics and data science courses throughout my projects. Gabby Isaguirre. Kristin Adderson. October 6, 2021 - 7:01am. September 17, 2021.
Technical Fellow, Tableau. Tableau has been helping people and organizations to see and understand data for almost two decades, bringing exciting innovations to the landscape of business intelligence with every product release. I am proud to announce that my History of Tableau Innovation viz is now published to Tableau Public.
Seattle has been home to Tableau for the past 17 years. While many legislatures, including Washington State’s, were out of session or focusing their efforts to address the COVID-19 pandemic, Salesforce and Tableau recognized a responsibility to take action. Zach Carstensen. State & Local Government Affairs, Salesforce.
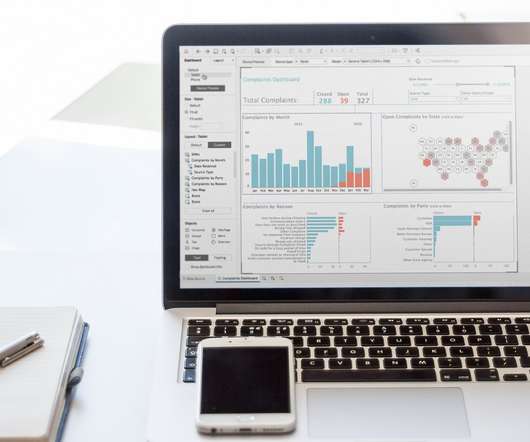
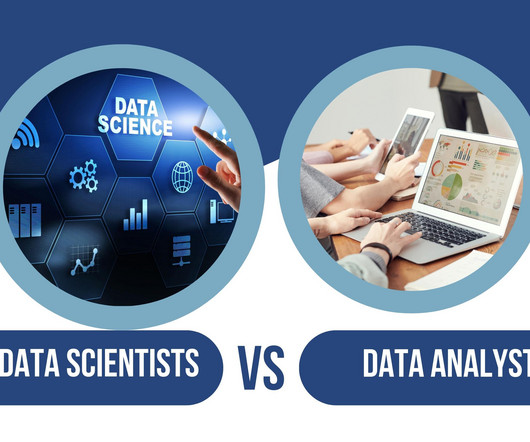
Dashboards, such as those built using Tableau or Power BI , provide real-time visualizations that help track key performance indicators (KPIs). Data Science is an interdisciplinary field that focuses on extracting knowledge and insights from structured and unstructured data. Data Scientists require a robust technical foundation.
Just as a writer needs to know core skills like sentence structure, grammar, and so on, data scientists at all levels should know core data science skills like programming, computerscience, algorithms, and so on. They’re looking for people who know all related skills, and have studied computerscience and software engineering.
To put it another way, a data scientist turns raw data into meaningful information using various techniques and theories drawn from many fields within the broad areas of mathematics, statistics, information science, and computerscience. Tools like Tableau, Matplotlib, Seaborn, or Power BI can be incredibly helpful.
Seattle has been home to Tableau for the past 17 years. While many legislatures, including Washington State’s, were out of session or focusing their efforts to address the COVID-19 pandemic, Salesforce and Tableau recognized a responsibility to take action. Zach Carstensen. State & Local Government Affairs, Salesforce. May 25, 2021.
Insights Retail and CPG enterprises typically use visualization tools such as Amazon QuickSight or third-party software such as Tableau to understand forecast results and share them across business units. To streamline the visualization, SageMaker Canvas provides embedded visualization for exploring forecast results.
QGIS, Microsoft's Power BI, Tableau, and Jupyter notebooks also facilitated many interesting visualizations, particularly for solvers with less programming experience. This year he plans to apply to universities in the USA to study computerscience or data science.
Summary: Bioinformatics Scientists apply computational methods to biological data, using tools like sequence analysis, gene expression analysis, and protein structure prediction to drive biological innovation and improve healthcare outcomes. As the field continues to grow, the demand for skilled Bioinformatics Scientists is increasing.
Here’s a roadmap to guide you Educational Foundation A bachelor’s degree in a quantitative field, such as computerscience, statistics, mathematics, or business, is typically required. Gain proficiency in data visualization tools like Tableau, Power BI, or Looker.
Tools like Tableau, Power BI, and Python libraries such as Matplotlib and Seaborn are commonly taught. R : Often used for statistical analysis and data visualization. Data Visualization : Techniques and tools to create visual representations of data to communicate insights effectively.
Significantly, Data Science experts have a strong foundation in mathematics, statistics, and computerscience. Accordingly, having technical subjects like Mathematics or ComputerScience might be advantageous. Who is a Data Analyst?
Data Visualization: Matplotlib, Seaborn, Tableau, etc. Data Engineering: Laying the Foundation for Data Success While Data Science deals with data analysis and insights, Data Engineering focuses on the design, construction, and maintenance of robust data pipelines and infrastructure. Big Data Technologies: Hadoop, Spark, etc.
A degree in computerscience, mathematics, statistics, or a related field is often preferred. Educational background Degrees: Many BI professionals have degrees in computerscience, information systems, mathematics, or statistics.
A degree in computerscience, mathematics, statistics, or a related field is often preferred. Educational background Degrees: Many BI professionals have degrees in computerscience, information systems, mathematics, or statistics.
Though you may encounter the terms “data science” and “data analytics” being used interchangeably in conversations or online, they refer to two distinctly different concepts. Data science is an area of expertise that combines many disciplines such as mathematics, computerscience, software engineering and statistics.
Exploring the Ocean If Big Data is the ocean, Data Science is the multifaceted discipline of extracting knowledge and insights from data, whether it’s big or small. It’s an interdisciplinary field that blends statistics, computerscience, and domain expertise to understand phenomena through data analysis.
A data analyst must also be skilled in Excel, Tableau, and other data visualization software. Data Visualization Tools: Tools such as Tableau, Power BI, and QlikView are used to create visualizations that help data analysts communicate their findings effectively to stakeholders.
Just as a writer needs to know core skills like sentence structure and grammar, data scientists at all levels should know core data science skills like programming, computerscience, algorithms, and soon. Theyre looking for people who know all related skills, and have studied computerscience and software engineering.
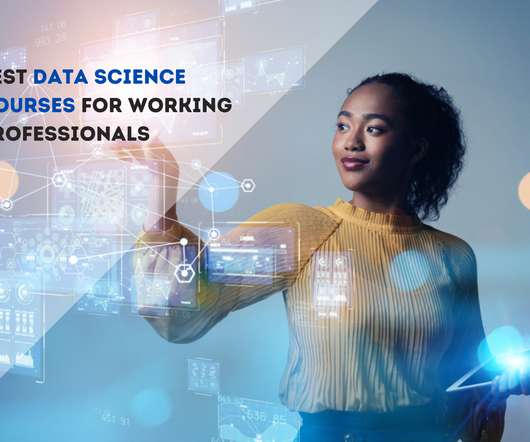
Here, you will find all the necessary information on how to find the best course for Data Science for beginners and how you can self-study to improve your learning. What is Data Science? The application of Data Science has expanded across the different niches: healthcare, finance, marketing, and technology.
Whether you’re from a technical or non-technical background, you can pursue Data Science as your career. You need to develop your knowledge and skills in programming languages, statistics, computerscience, machine learning, etc. Let’s get started with the blog on the best Data Science Institute in Chennai.
GreatLearning PG Program in Data Science and Business Analytics Individuals without coding experience and looking to make a career in the Data Science domain can now easily transition with the MyGreatLearning Data Science course. Student Go for Data Science Course? Yes, BSE students can opt for Data Science courses.
Some of these specialism are: Python TensorFlow SQL Tableau PowerBI Keras Matlab Spark R HTML/CSS/JS Finding You Another aspect that you should look into is who can reach you. Here you will get the profile URL. Key Skills Need a Mention As a Data Scientist, you should master certain skill sets. Wrapping it up !!!
Because they are the most likely to communicate data insights, they’ll also need to know SQL, and visualization tools such as Power BI and Tableau as well. Some of the tools and techniques unique to business analysts are pivot tables, financial modeling in Excel, Power BI Dashboards for forecasting, and Tableau for similar purposes.
Key Takeaways Pickl.AI’s Data Science Job Guarantee Program offers an online comprehensive curriculum and practical training. With a 1-year job guarantee, it focuses on essential skills like Python, Tableau, SQL, and machine learning. Designed to develop a strong foundation in Data Science principles.
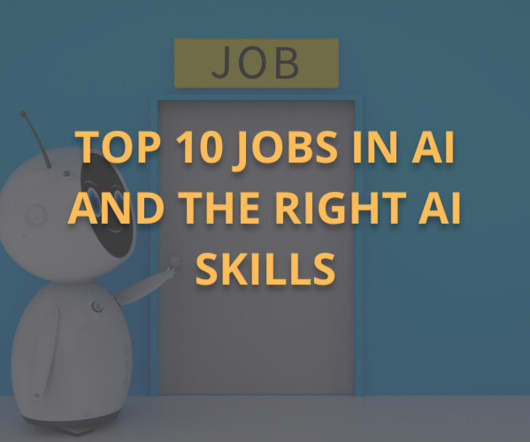
Most AI jobs require a degree in computerscience or a related field along with specialized training or certifications in machine learning or data science. They play a crucial role in shaping business strategies based on data insights. Salary Range: 6,00,000 – 18,00,000 per annum.
These include: Strong mathematical and computerscience background Experience in working with large amount of datasets Have the ability to work with Machine Learning and Statistical Modeling Strong skills of communication and visualization A willingness to learn by pursuing Data Science certificate programs.
After completing a Bachelor of Computer Applications (BCA) degree, many graduates find themselves at a crucial crossroads, eager to delve deeper into the world of information technology and computerscience. This interdisciplinary approach allows you to collaborate with professionals from diverse backgrounds and industries.
Data Science is a broad, multidisciplinary field that encompasses mathematics, computerscience, and statistics to collect, manage, and analyze large-scale data. Tableau and Power BI : Visualisation tools that create interactive dashboards and reports. SQL : A database language to fetch and analyse data.
Data science is the process of extracting the valuable minerals – the insights – that can transform your business. It’s a blend of statistics, computerscience, and domain knowledge used to extract knowledge and create solutions from data. Data science for business leaders isn’t about becoming a coding pro.
These include the following: Introduction to Data Science Introduction to Python SQL for Data Analysis Statistics Data Visualization with Tableau 5. Data Science Program for working professionals by Pickl.AI Another popular Data Science course for working professionals is offered by Pickl.AI.
By the end of this blog, you will feel empowered to explore the exciting world of Data Science and achieve your career goals. Proficiency with tools like Tableau , Matplotlib , and ggplot2 helps create charts, graphs, and dashboards that effectively communicate insights to stakeholders.
Tableau), communication skills Combine business studies with data courses, engage in case studies, and attend industry conferences. Machine Learning Engineer Designs and develops algorithms that enable computers to learn from and make predictions or decisions based on data. 9,43,649 Business acumen, Data Visualisation tools (e.g.,
Understanding Data Science Data Science is a multidisciplinary field that uses scientific methods, algorithms, and systems to extract knowledge and insights from structured and unstructured data. It combines principles from statistics, mathematics, computerscience, and domain-specific knowledge to analyse and interpret complex data.
Research Scientist, Tableau. Editor's note: This article originally appeared in the Tableau Engineering Blog. Data science has exploded over the past decade, changing the way that we conduct business and prepare the next generation of young people for the jobs of the future. Ana Crisan. Kristin Adderson. February 24, 2021.
Automation, ethical AI, and quantum computing will shape Data Science by 2025. What Is Data Science? At its core, Data Science is an interdisciplinary field that combines mathematics, statistics, computerscience, and domain expertise to extract actionable insights from structured and unstructured data.
Research Scientist, Tableau. Editor's note: This article originally appeared in the Tableau Engineering Blog. Data science has exploded over the past decade, changing the way that we conduct business and prepare the next generation of young people for the jobs of the future. Ana Crisan. Kristin Adderson. February 24, 2021.
We organize all of the trending information in your field so you don't have to. Join 17,000+ users and stay up to date on the latest articles your peers are reading.
You know about us, now we want to get to know you!
Let's personalize your content
Let's get even more personalized
We recognize your account from another site in our network, please click 'Send Email' below to continue with verifying your account and setting a password.


Let's personalize your content